 1
1peptide
spectra
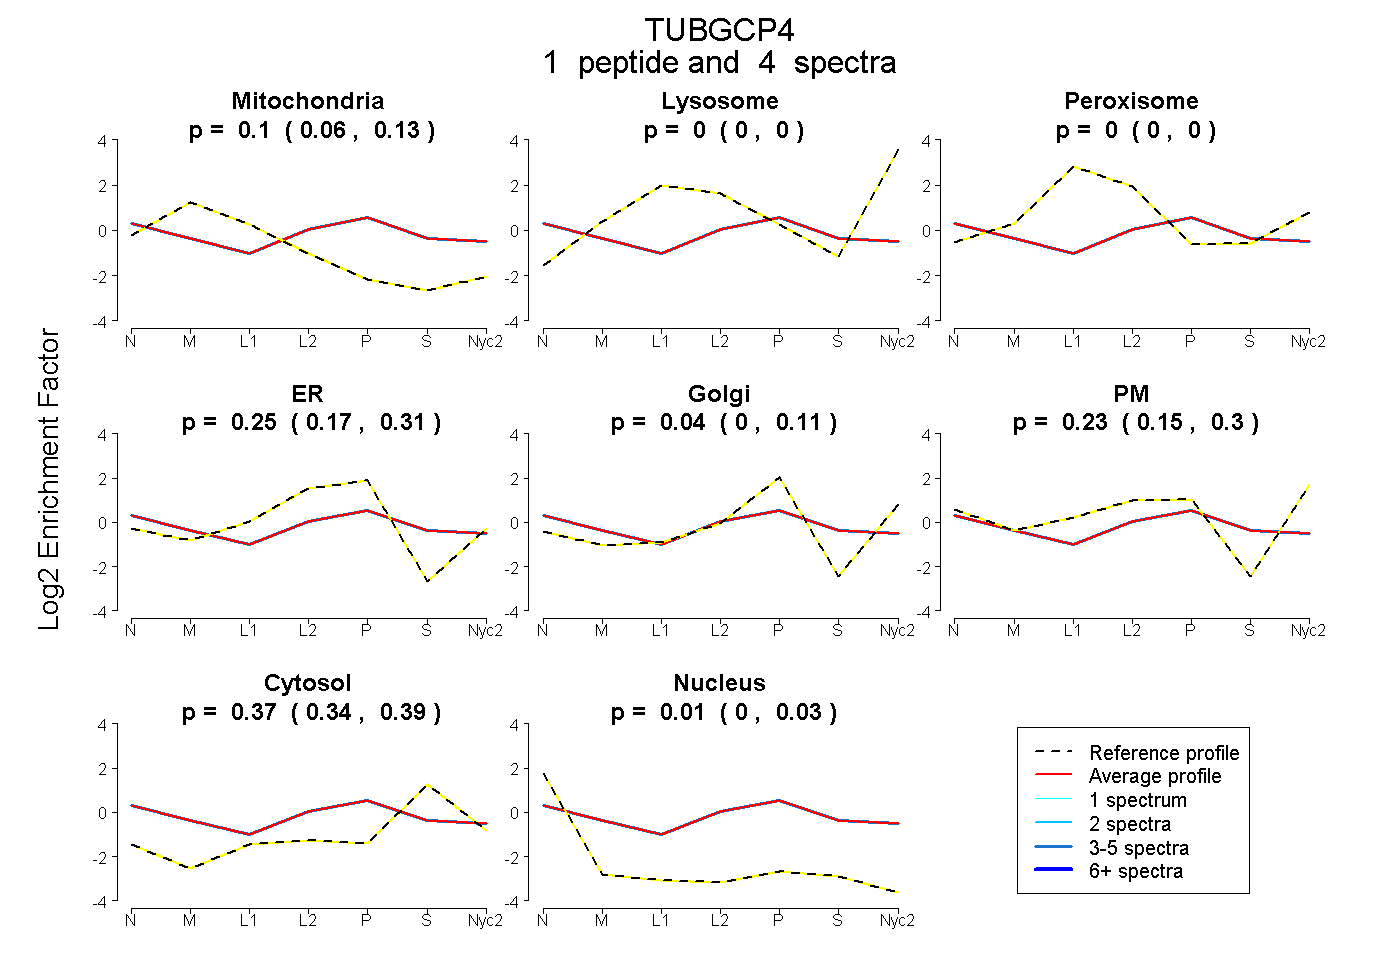
0.059 | 0.126
0.000 | 0.000
0.000 | 0.000
0.166 | 0.310
0.000 | 0.113
0.150 | 0.303
0.341 | 0.387
0.000 | 0.030
3peptides
spectra
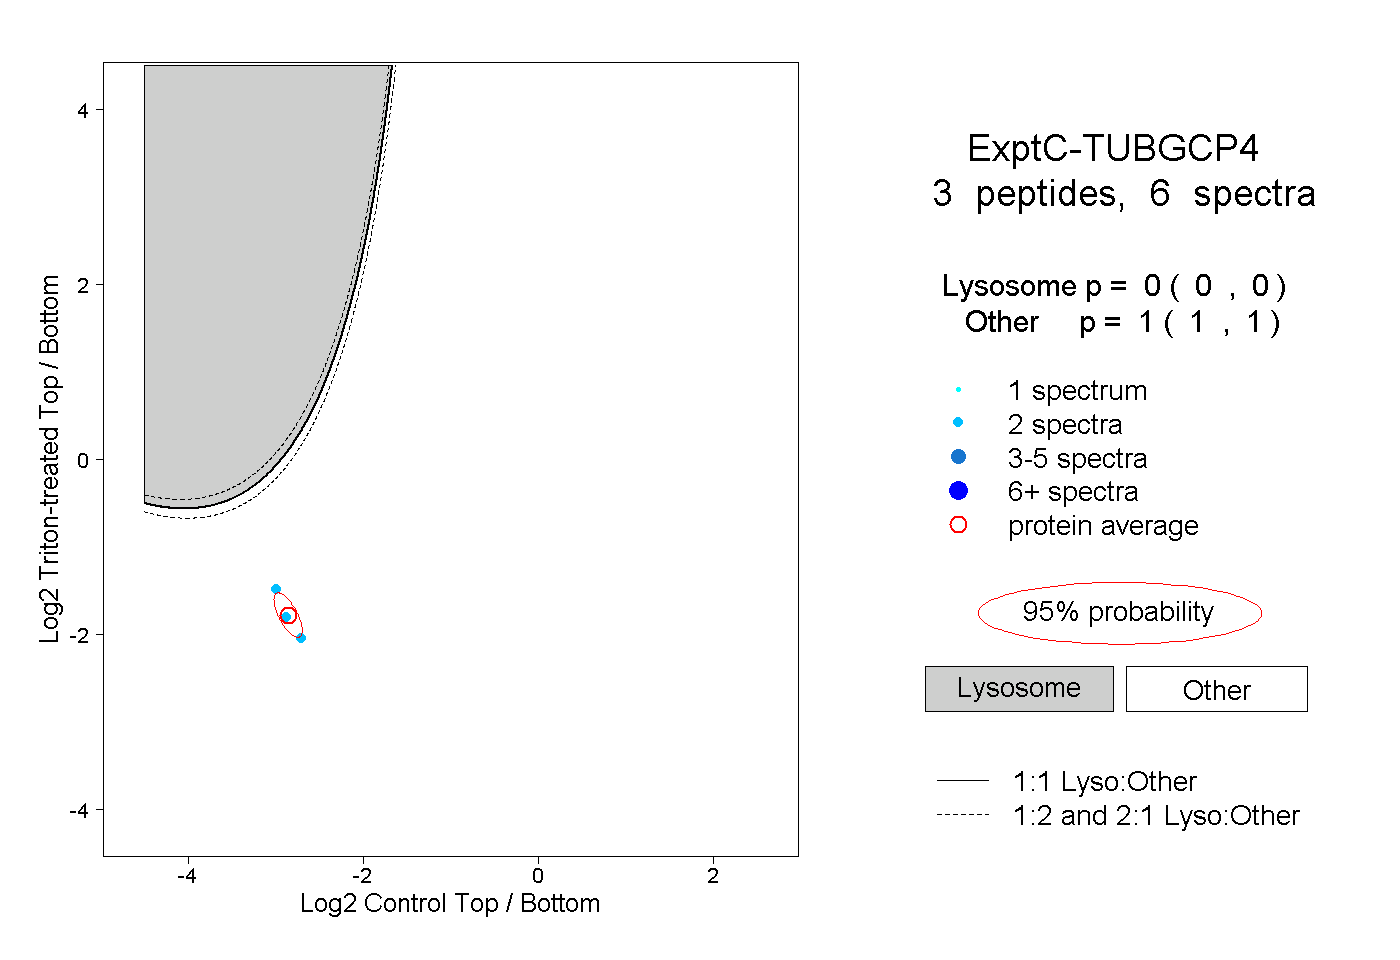
0.000 | 0.000
1.000 | 1.000
| Plot | Mito | Lyso | Perox | ER | Golgi | PM | Cytosol | Nucleus | |||||
| Expt A |
1 peptide |
4 spectra |
|
0.099 0.059 | 0.126 |
0.000 0.000 | 0.000 |
0.000 0.000 | 0.000 |
0.245 0.166 | 0.310 |
0.044 0.000 | 0.113 |
0.233 0.150 | 0.303 |
0.368 0.341 | 0.387 |
0.010 0.000 | 0.030 |
||
| Plot | Lyso | Other | |||||||||||
| Expt C |
3 peptides |
6 spectra |
|
0.000 0.000 | 0.000 |
1.000 1.000 | 1.000 |