 11
11peptides
spectra
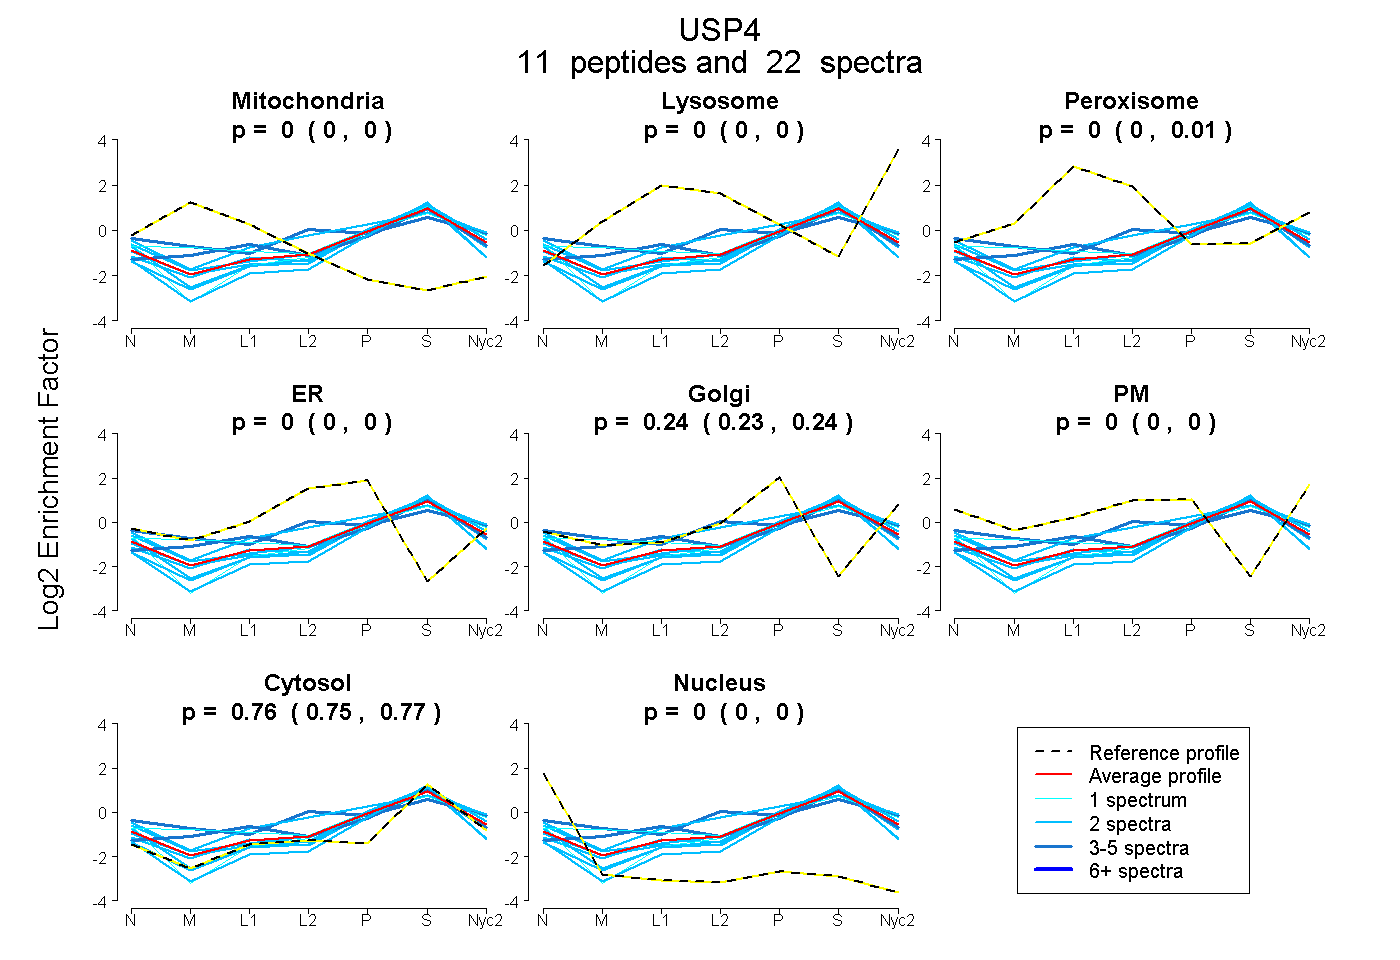
0.000 | 0.000
0.000 | 0.000
0.000 | 0.009
0.000 | 0.000
0.231 | 0.243
0.000 | 0.000
0.752 | 0.767
0.000 | 0.000
| Plot | Mito | Lyso | Perox | ER | Golgi | PM | Cytosol | Nucleus | |||||
| Expt A |
11 peptides |
22 spectra |
|
0.000 0.000 | 0.000 |
0.000 0.000 | 0.000 |
0.000 0.000 | 0.009 |
0.000 0.000 | 0.000 |
0.239 0.231 | 0.243 |
0.000 0.000 | 0.000 |
0.761 0.752 | 0.767 |
0.000 0.000 | 0.000 |
| 2 spectra, STLAIDWDSETR | 0.000 | 0.000 | 0.000 | 0.000 | 0.178 | 0.000 | 0.822 | 0.000 | ||
| 3 spectra, DTHVAPR | 0.000 | 0.000 | 0.097 | 0.063 | 0.000 | 0.267 | 0.572 | 0.000 | ||
| 2 spectra, AAIALR | 0.000 | 0.000 | 0.000 | 0.000 | 0.180 | 0.000 | 0.804 | 0.016 | ||
| 2 spectra, GEIAEAYAELIK | 0.000 | 0.000 | 0.000 | 0.000 | 0.204 | 0.000 | 0.796 | 0.000 | ||
| 2 spectra, EAWENHR | 0.000 | 0.000 | 0.089 | 0.058 | 0.131 | 0.115 | 0.607 | 0.000 | ||
| 1 spectrum, LFNIPAER | 0.050 | 0.028 | 0.076 | 0.000 | 0.249 | 0.000 | 0.596 | 0.000 | ||
| 2 spectra, VEVYLLELK | 0.000 | 0.000 | 0.000 | 0.000 | 0.049 | 0.000 | 0.915 | 0.036 | ||
| 3 spectra, ILVVHLK | 0.046 | 0.000 | 0.134 | 0.000 | 0.123 | 0.000 | 0.696 | 0.000 | ||
| 2 spectra, DEYEAEINR | 0.000 | 0.000 | 0.000 | 0.000 | 0.202 | 0.069 | 0.730 | 0.000 | ||
| 2 spectra, ALNMSEFVCDR | 0.000 | 0.000 | 0.000 | 0.038 | 0.127 | 0.000 | 0.835 | 0.000 | ||
| 1 spectrum, GTHERPDVETQK | 0.000 | 0.000 | 0.000 | 0.000 | 0.168 | 0.000 | 0.827 | 0.004 |
| Plot | Mito | Lyso or Perox | ER | Golgi | PM | Cytosol | Nucleus | ||||||
| Expt B |
1 peptide |
1 spectrum |
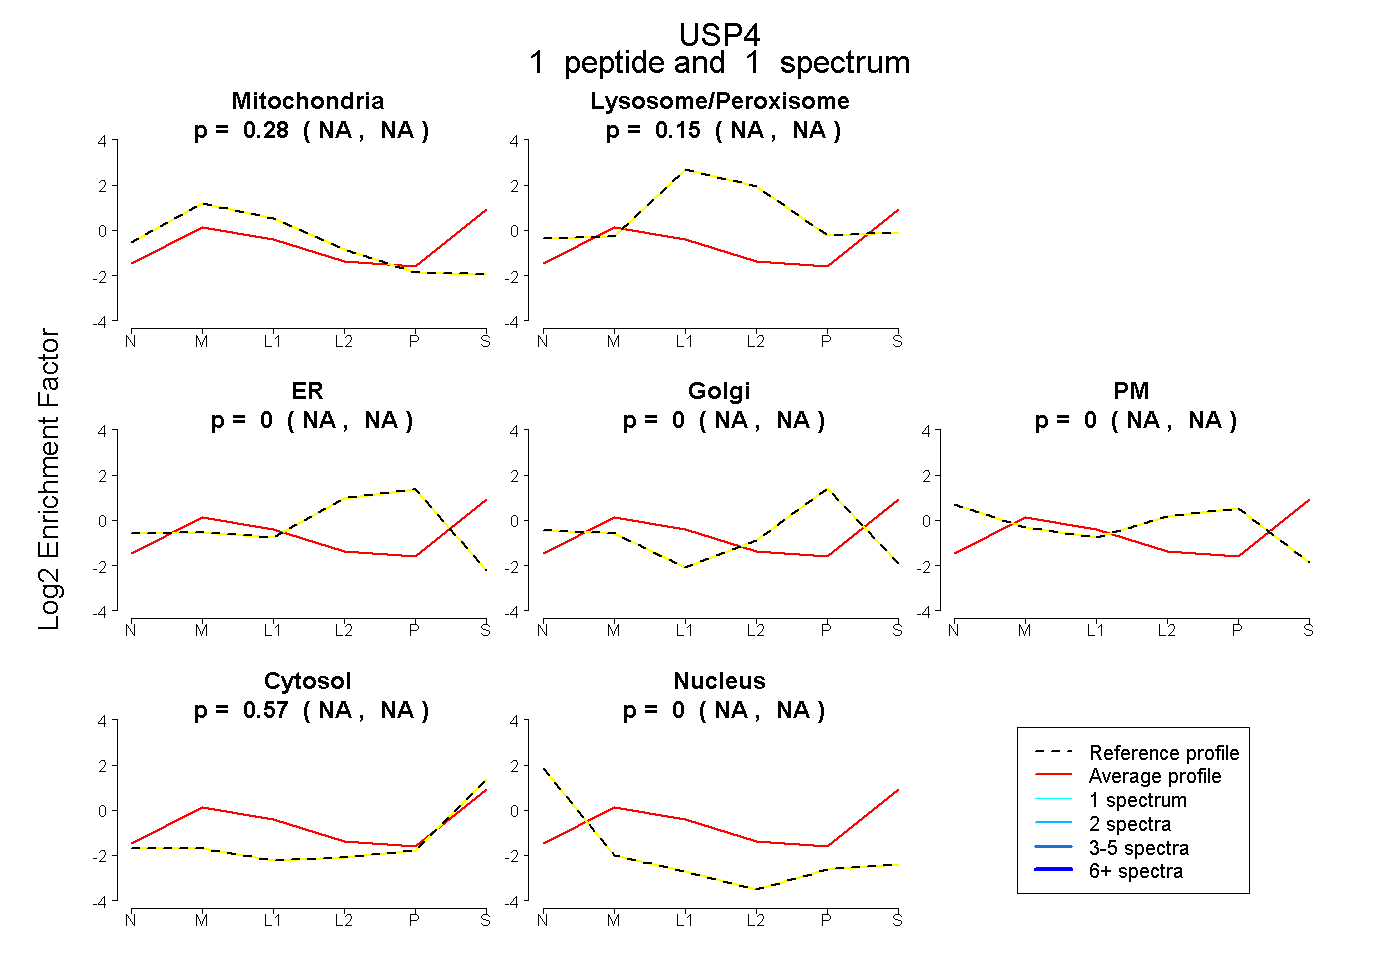 |
0.281 NA | NA |
0.150 NA | NA |
0.000 NA | NA |
0.000 NA | NA |
0.000 NA | NA |
0.569 NA | NA |
0.000 NA | NA |
|||
| Plot | Lyso | Other | |||||||||||
| Expt C |
1 peptide |
2 spectra |
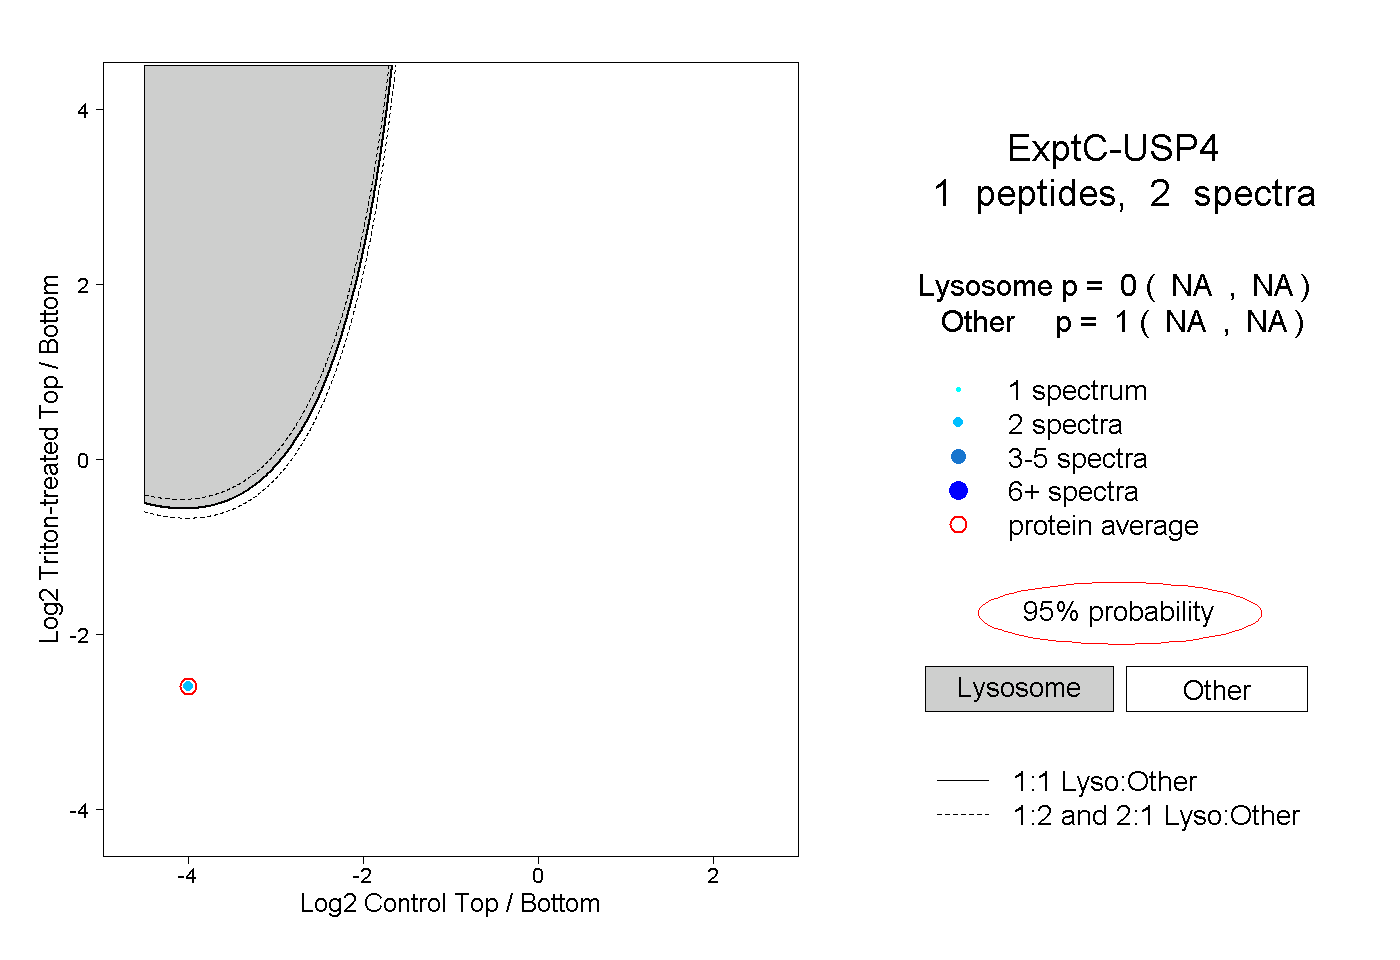 |
0.000 NA | NA |
1.000 NA | NA |
||||||||
| Plot | Lyso | Other | |||||||||||
| Expt D |
1 peptide |
2 spectra |
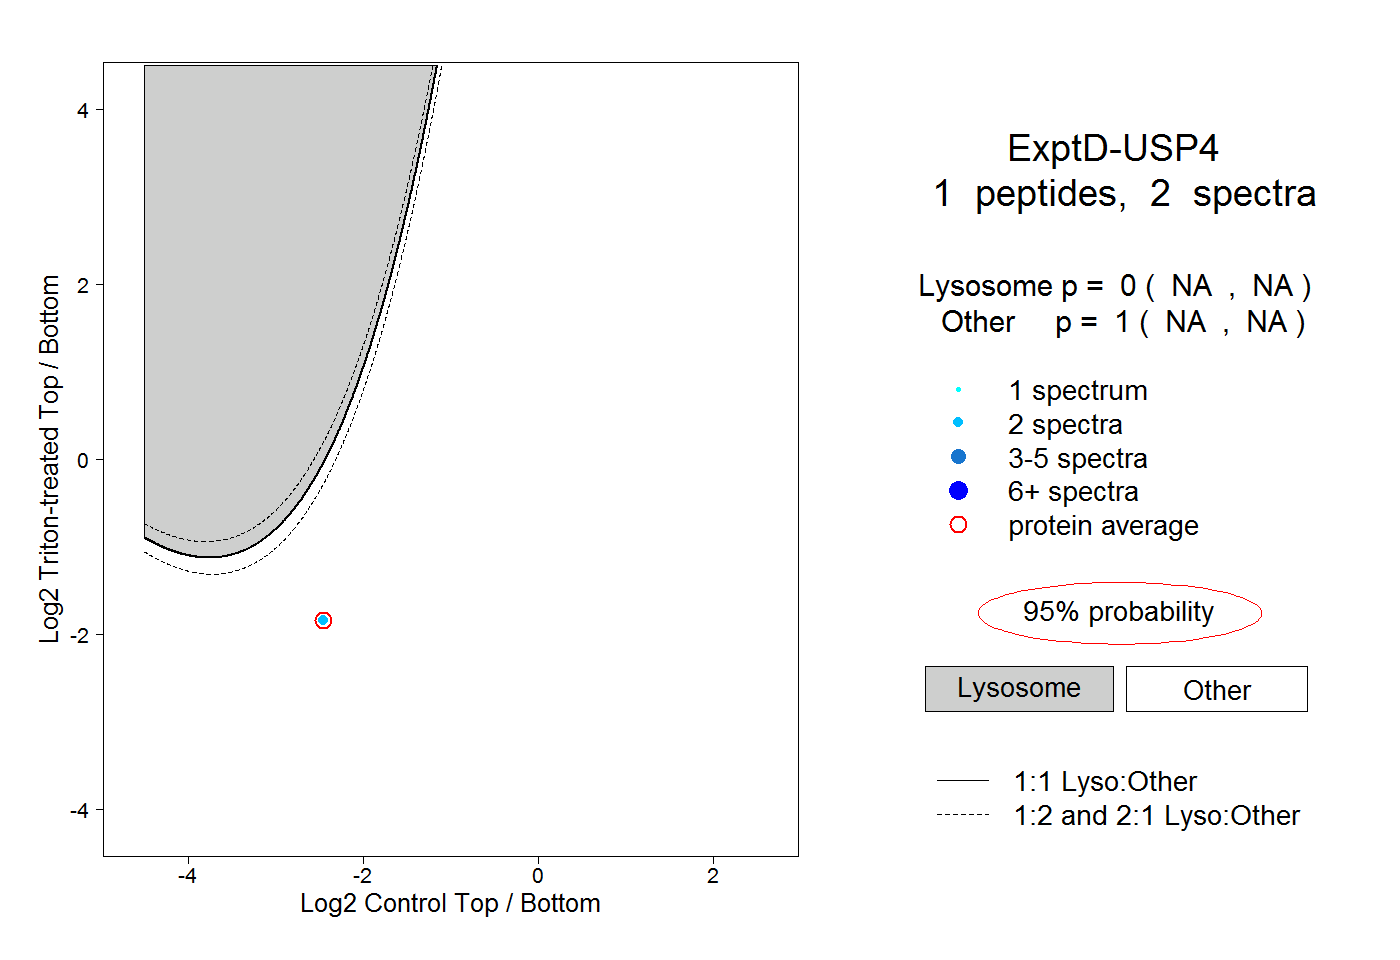 |
0.000 NA | NA |
1.000 NA | NA |