 1
1peptide
spectra
0.000 | 0.014
0.000 | 0.198
0.406 | 0.851
0.000 | 0.361
0.000 | 0.173
0.000 | 0.004
0.000 | 0.001
1peptide
spectra
NA | NA
NA | NA
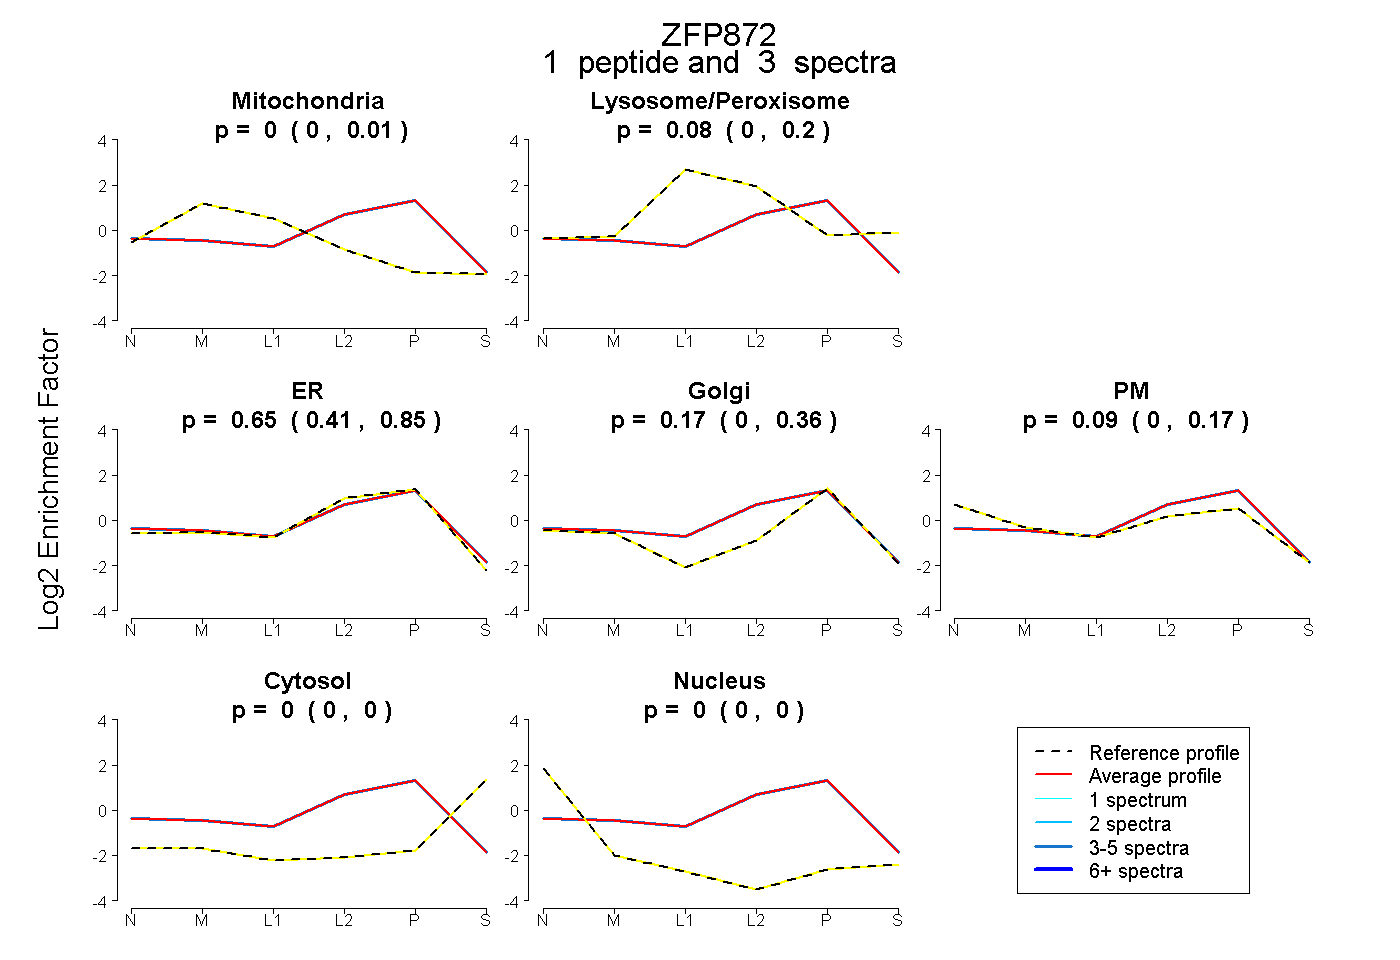
| Plot | Mito | Lyso or Perox | ER | Golgi | PM | Cytosol | Nucleus | ||||||
| Expt B |
1 peptide |
3 spectra |
|
0.000 0.000 | 0.014 |
0.079 0.000 | 0.198 |
0.654 0.406 | 0.851 |
0.174 0.000 | 0.361 |
0.093 0.000 | 0.173 |
0.000 0.000 | 0.004 |
0.000 0.000 | 0.001 |
|||
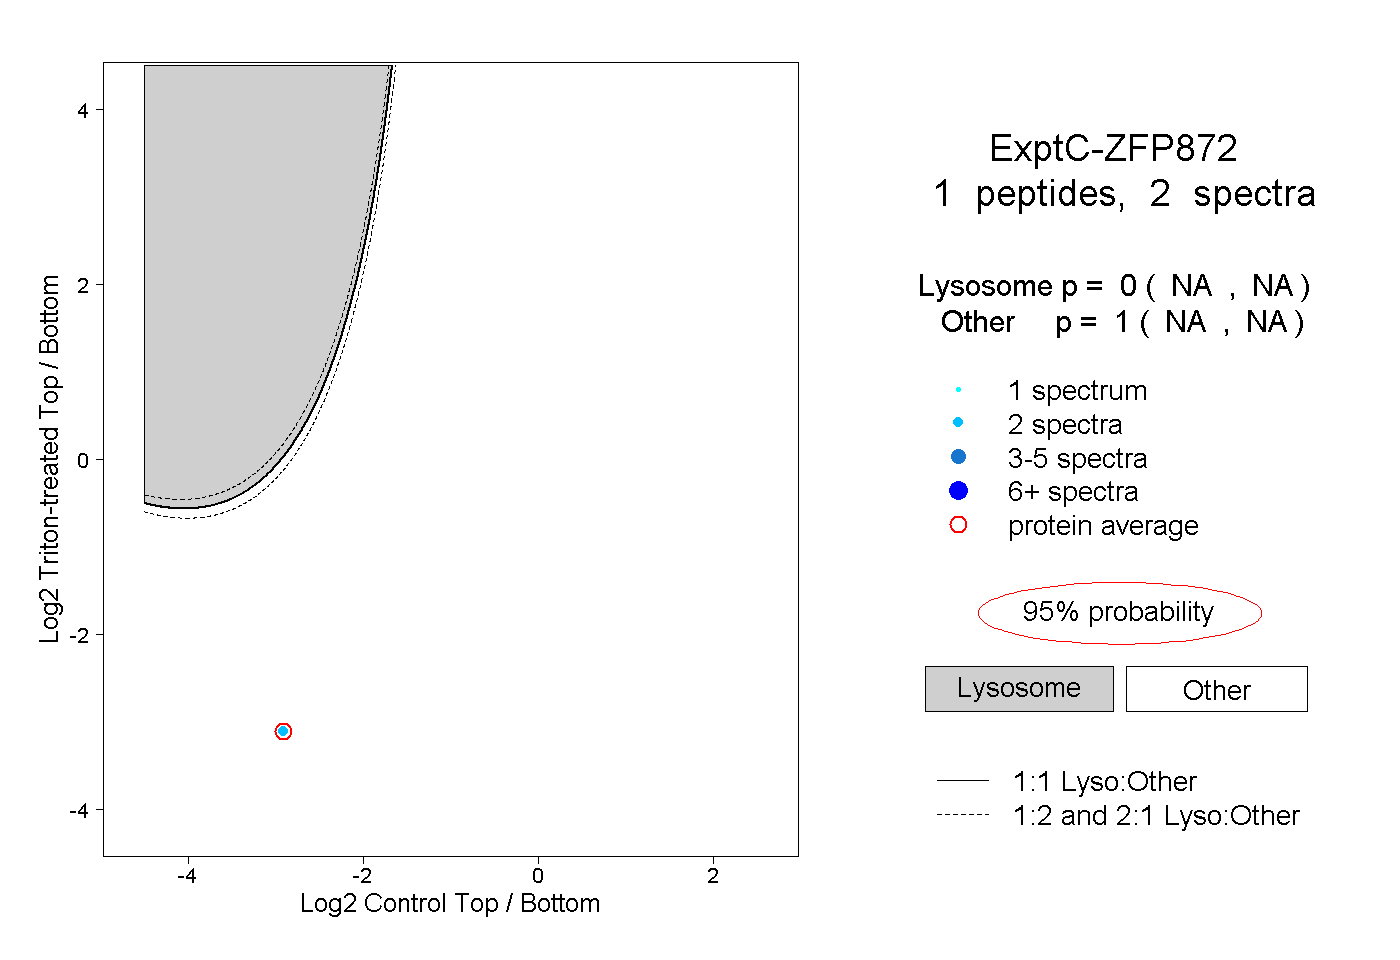
| Plot | Lyso | Other | |||||||||||
| Expt C |
1 peptide |
2 spectra |
|
0.000 NA | NA |
1.000 NA | NA |