 3
3peptides
spectra
0.000 | 0.000
0.000 | 0.000
0.000 | 0.001
0.000 | 0.200
0.000 | 0.264
0.000 | 0.124
0.695 | 0.822
0.000 | 0.034
1peptide
spectra
NA | NA
NA | NA
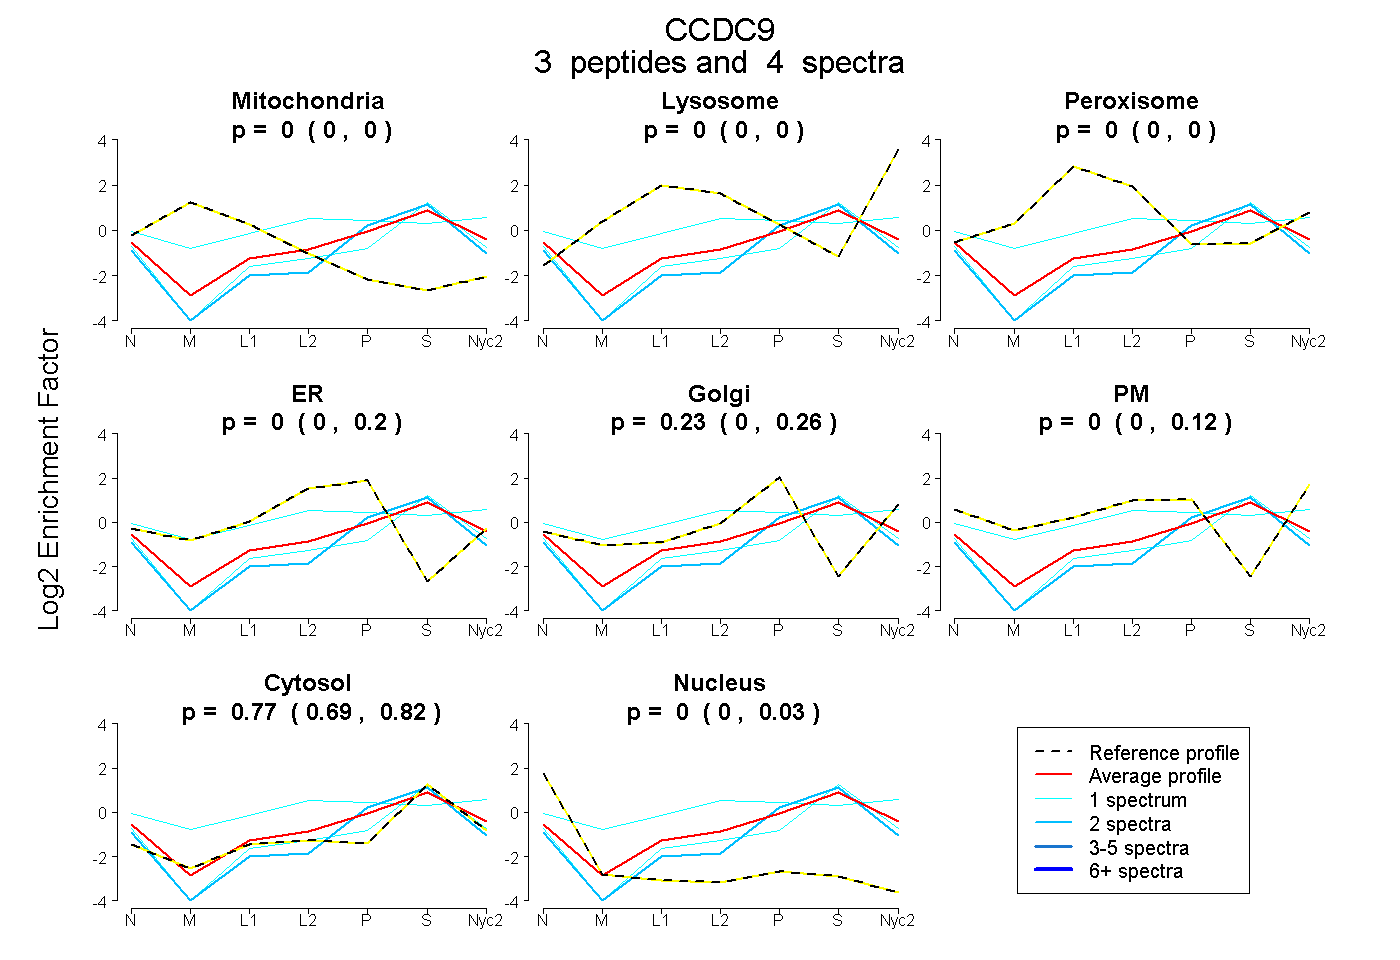
| Plot | Mito | Lyso | Perox | ER | Golgi | PM | Cytosol | Nucleus | |||||
| Expt A |
3 peptides |
4 spectra |
|
0.000 0.000 | 0.000 |
0.000 0.000 | 0.000 |
0.000 0.000 | 0.001 |
0.000 0.000 | 0.200 |
0.231 0.000 | 0.264 |
0.000 0.000 | 0.124 |
0.769 0.695 | 0.822 |
0.000 0.000 | 0.034 |
||
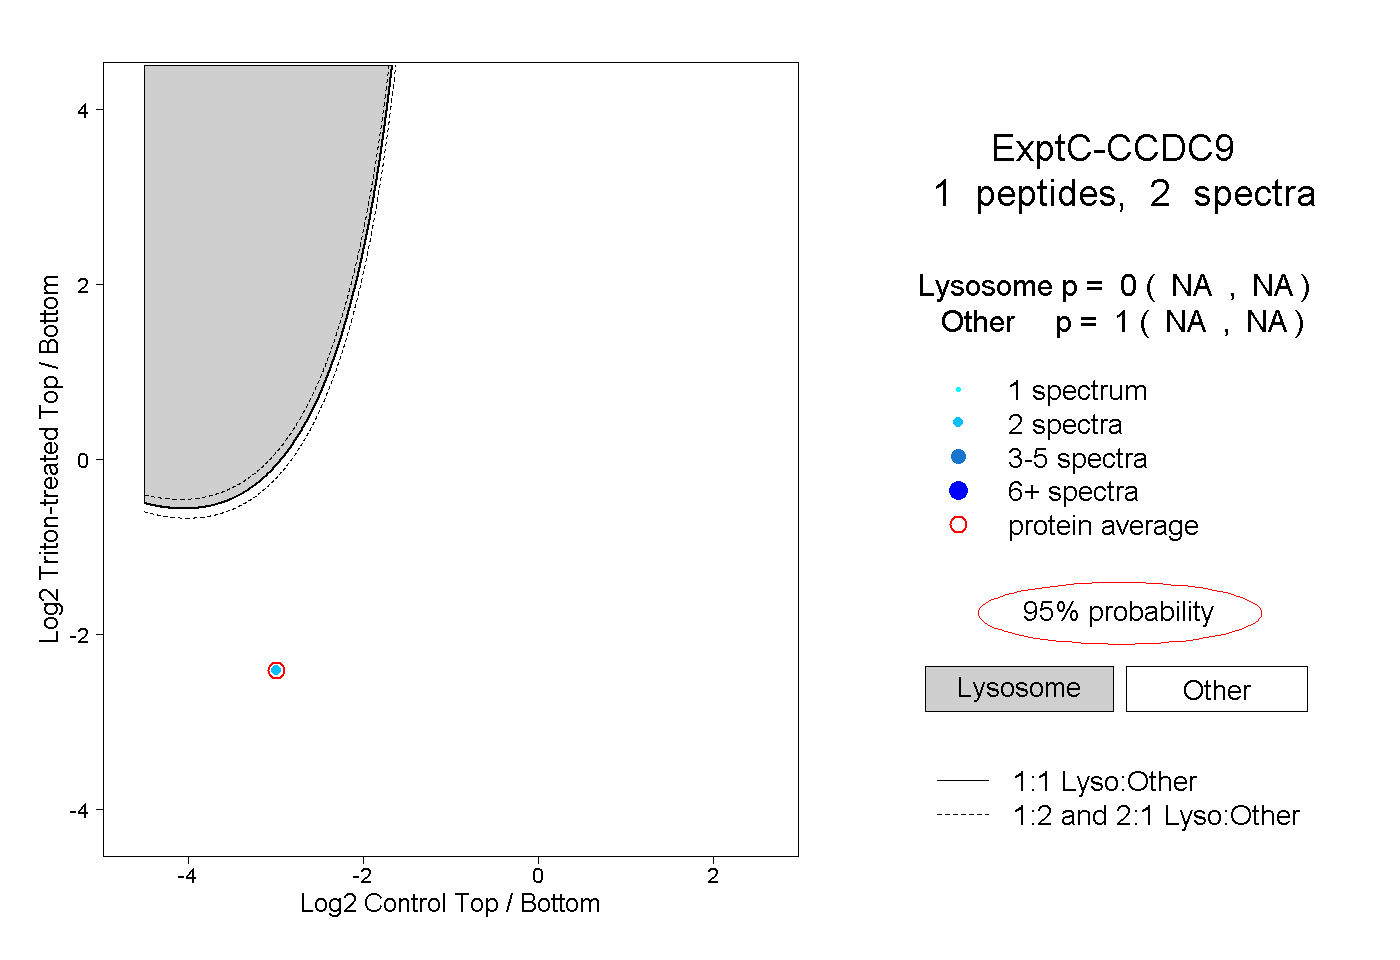
| Plot | Lyso | Other | |||||||||||
| Expt C |
1 peptide |
2 spectra |
|
0.000 NA | NA |
1.000 NA | NA |