 3
3peptides
spectra
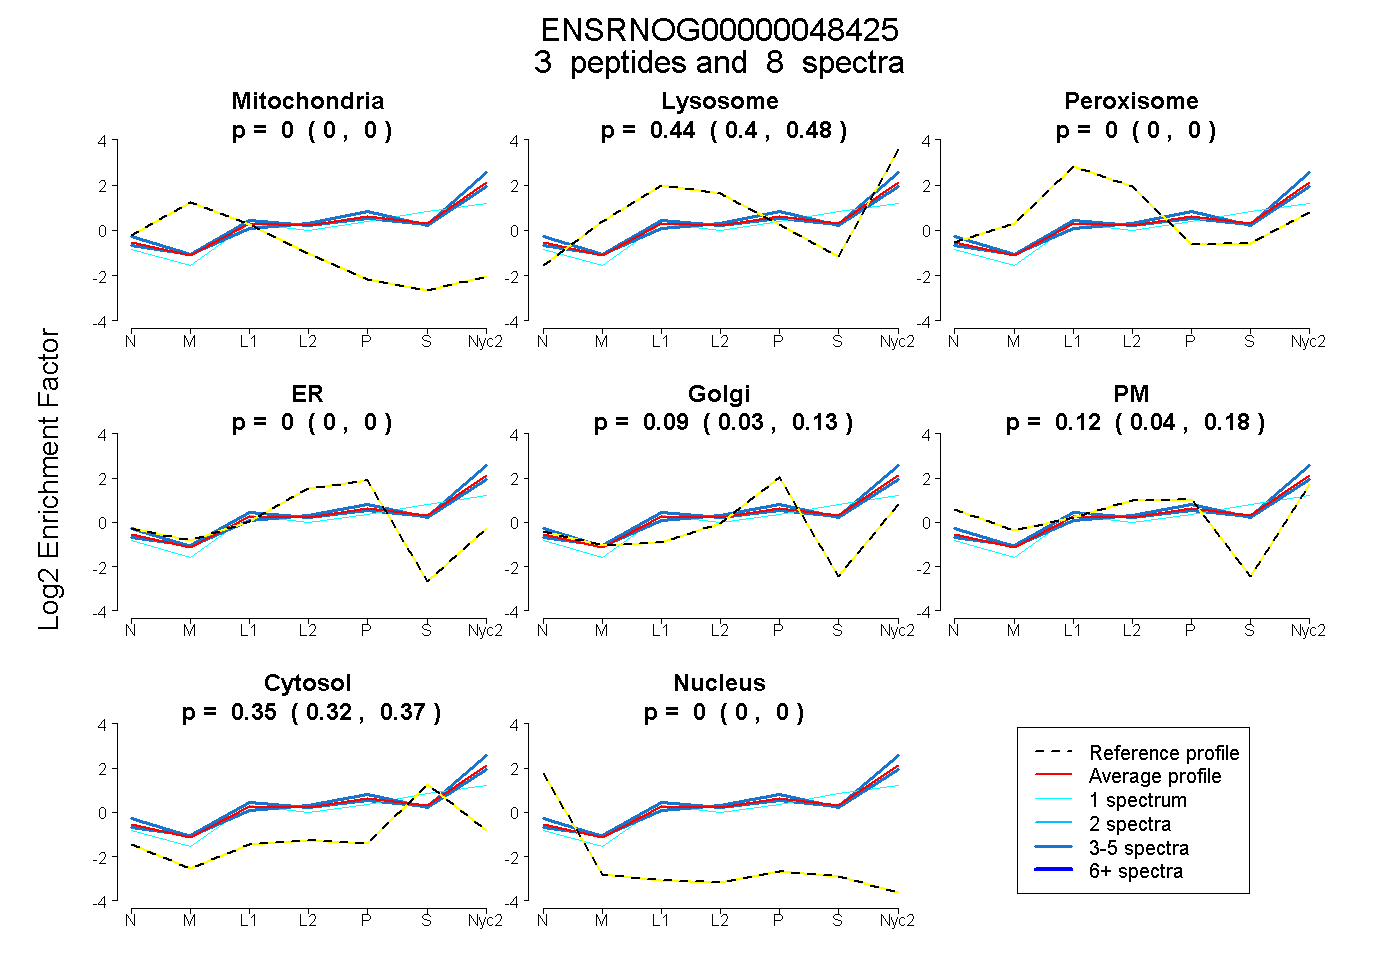
0.000 | 0.000
0.397 | 0.479
0.000 | 0.000
0.000 | 0.000
0.030 | 0.135
0.045 | 0.179
0.325 | 0.374
0.000 | 0.000
1peptide
spectra
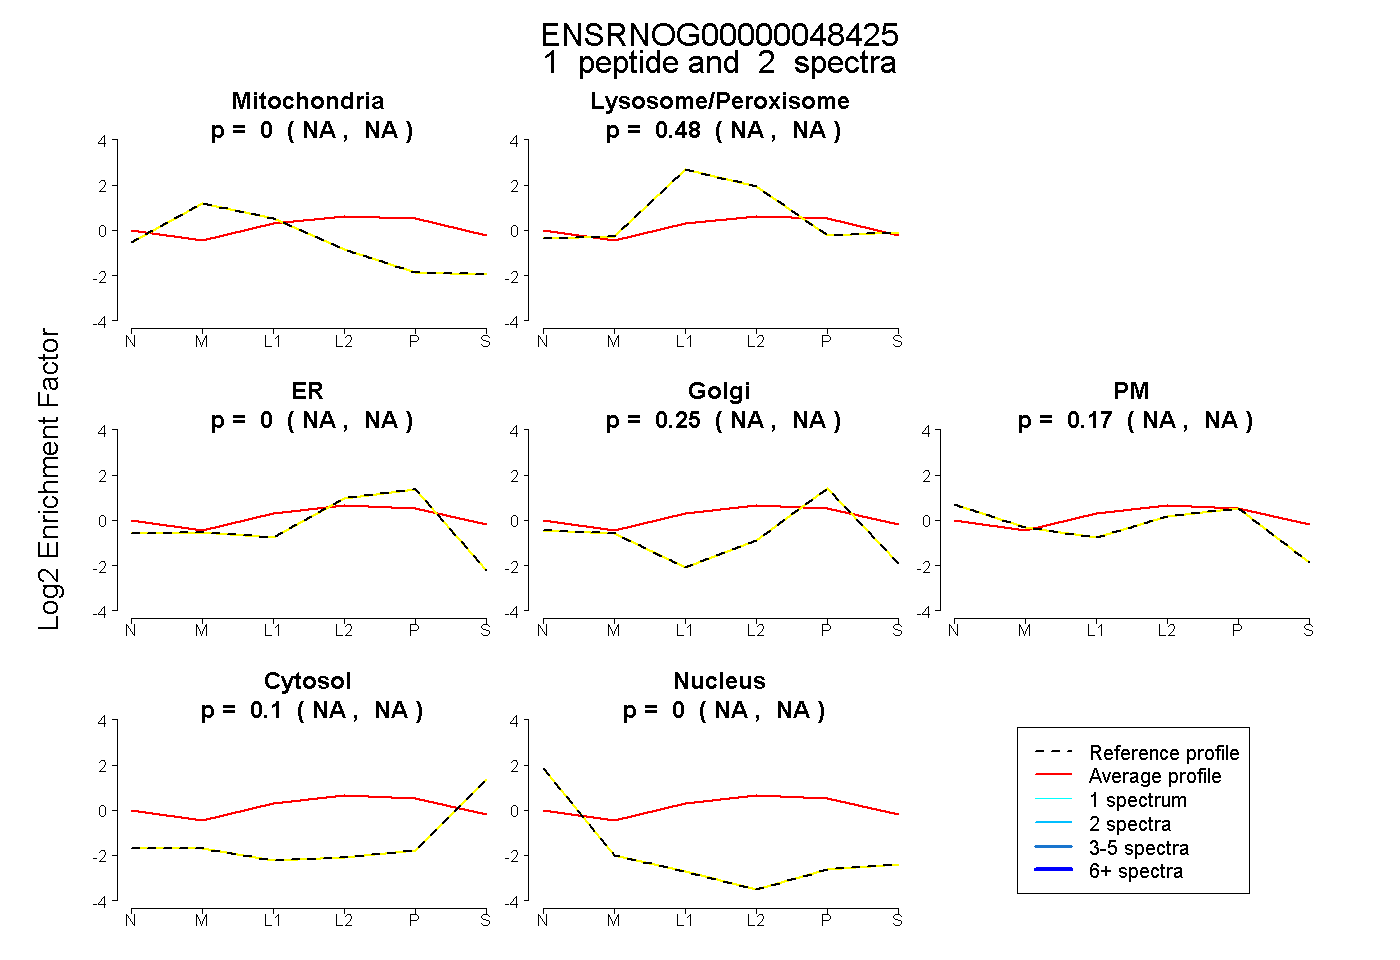
NA | NA
NA | NA
NA | NA
NA | NA
NA | NA
NA | NA
NA | NA
3peptides
spectra
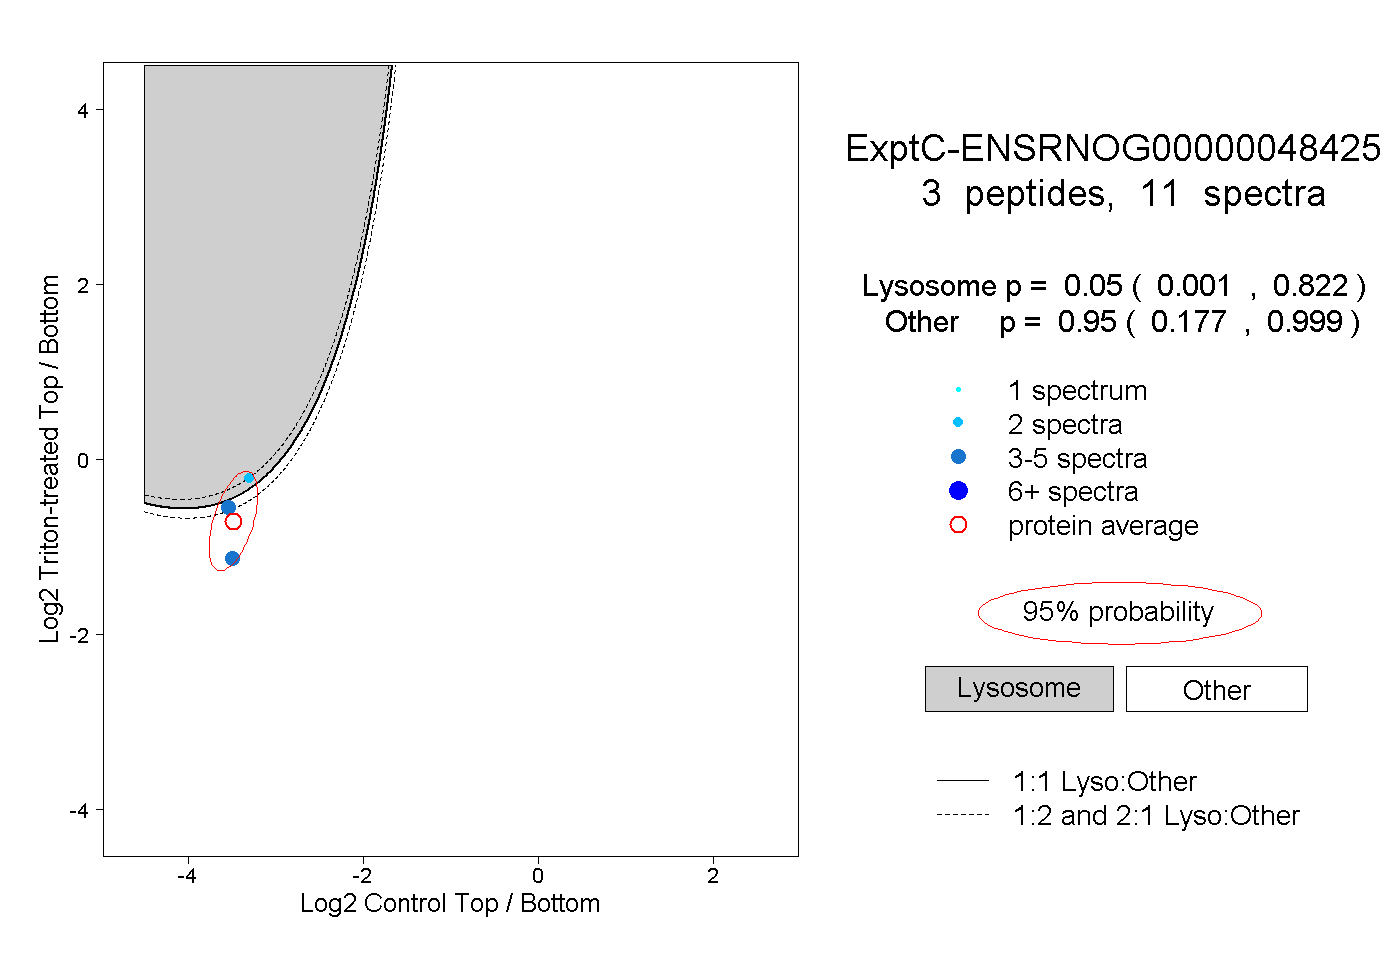
0.001 | 0.822
0.177 | 0.999
1peptide
spectrum
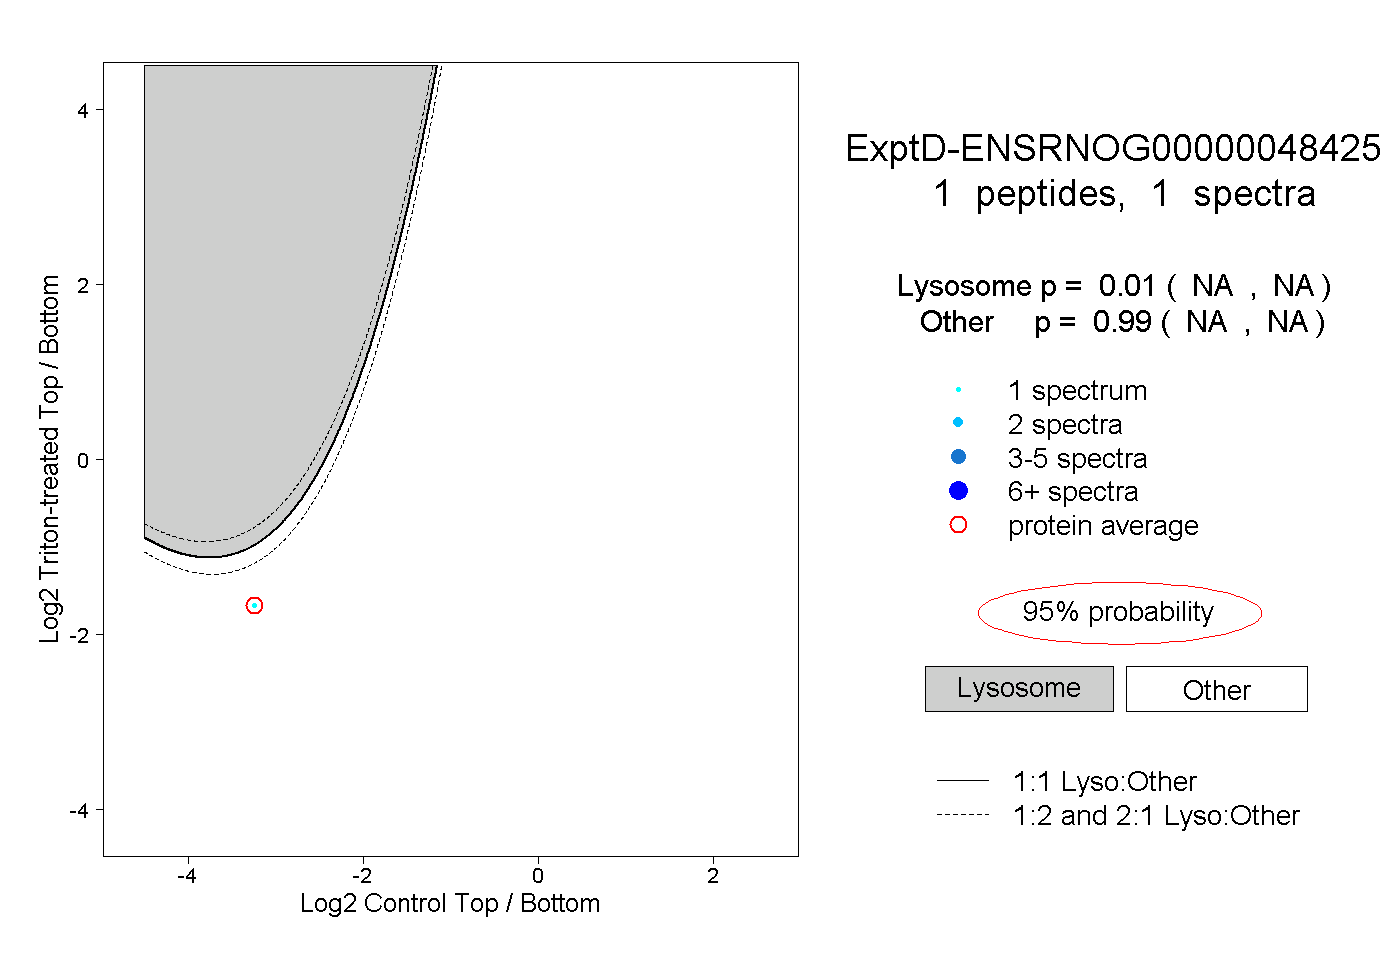
NA | NA
NA | NA