13
13peptides
spectra
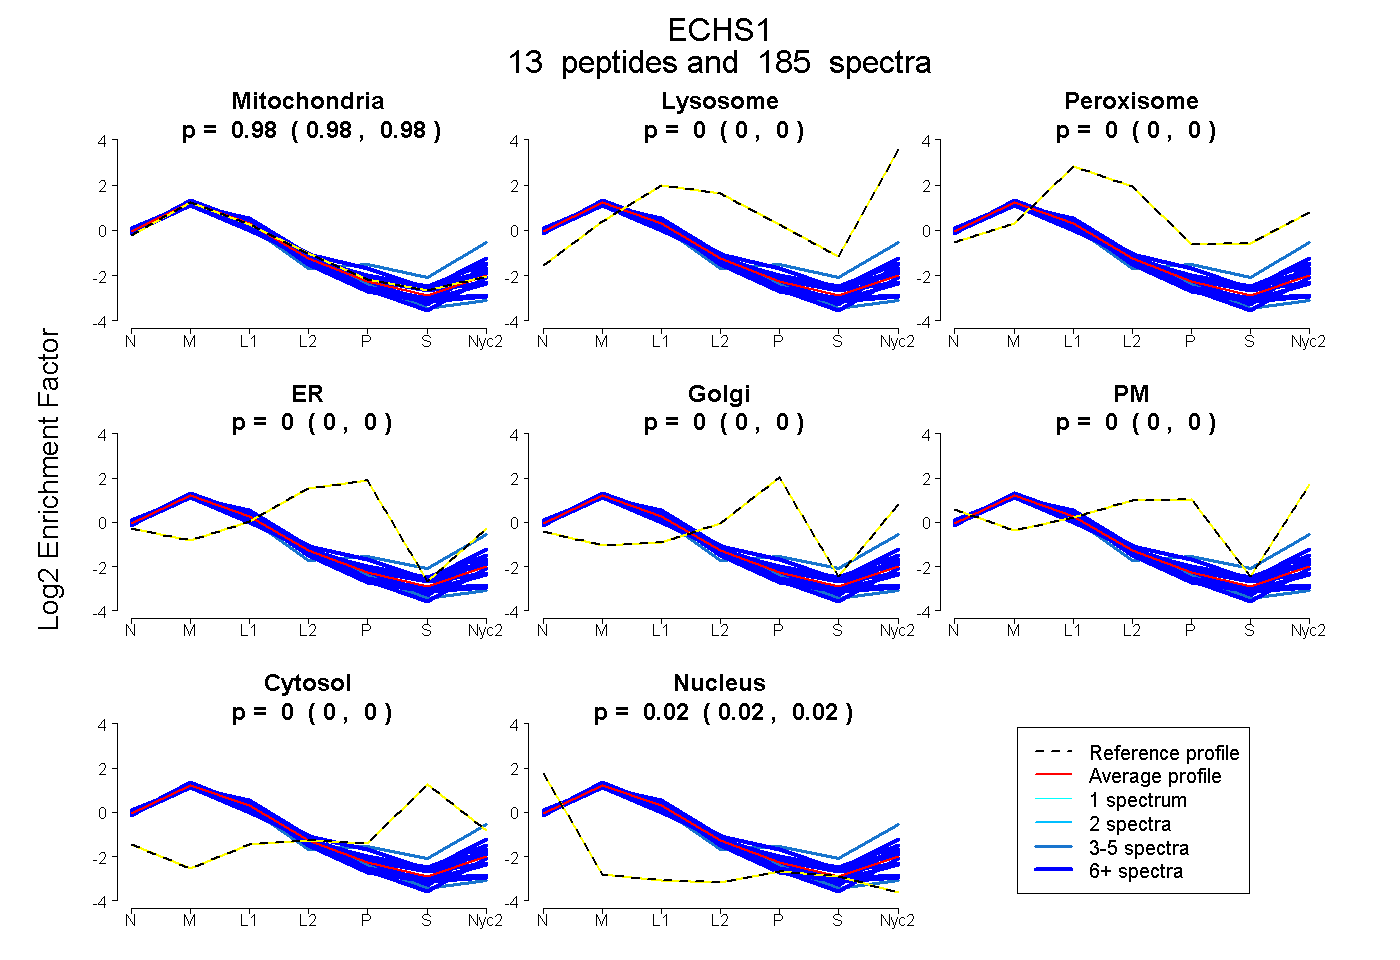
0.977 | 0.980
0.000 | 0.000
0.000 | 0.000
0.000 | 0.000
0.000 | 0.000
0.000 | 0.000
0.000 | 0.000
0.020 | 0.023
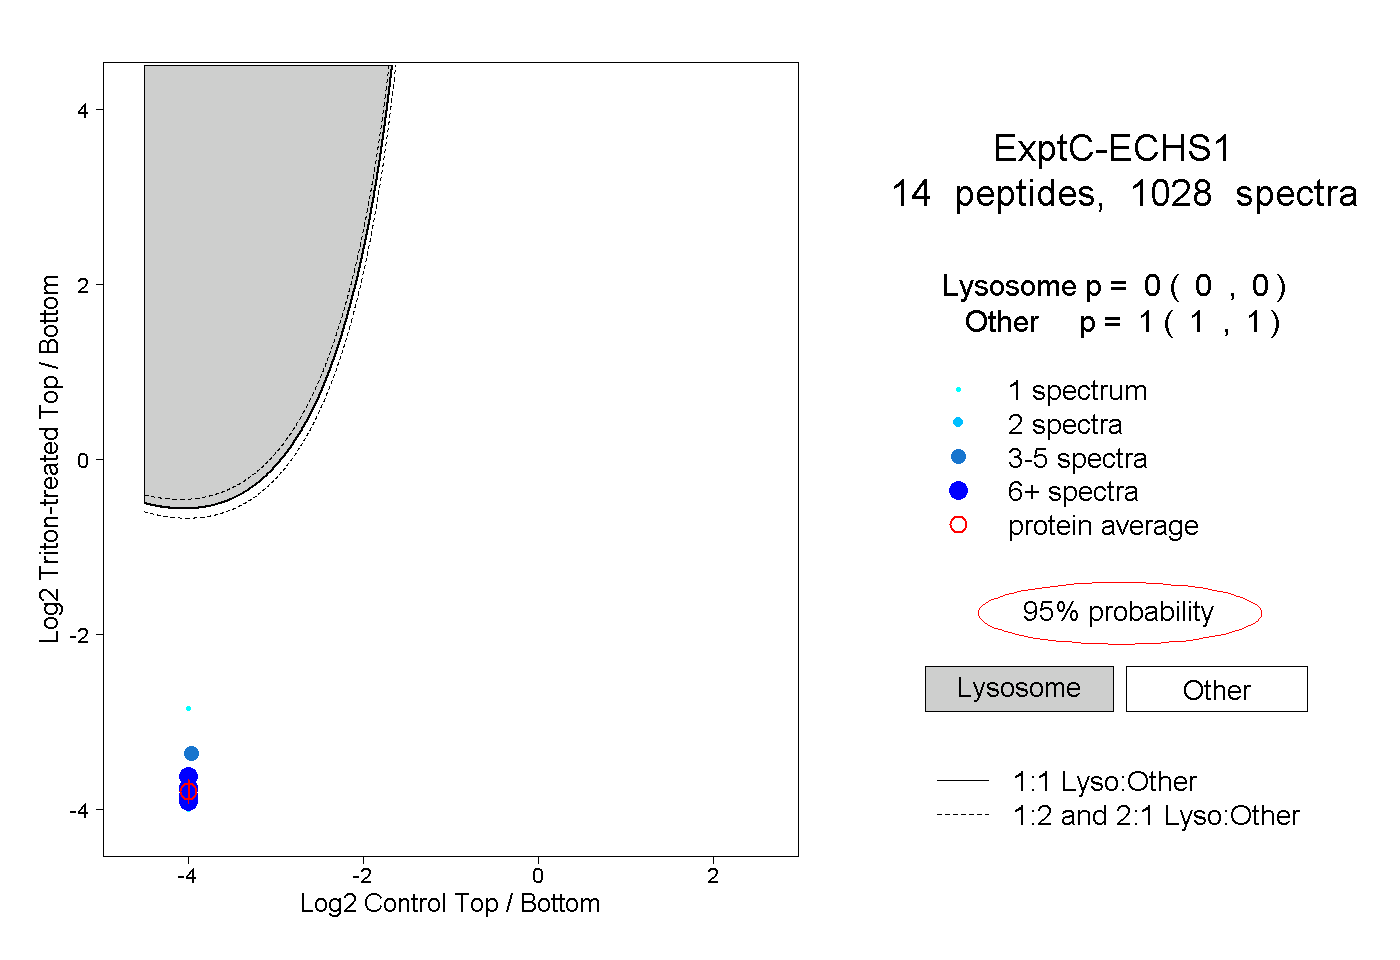
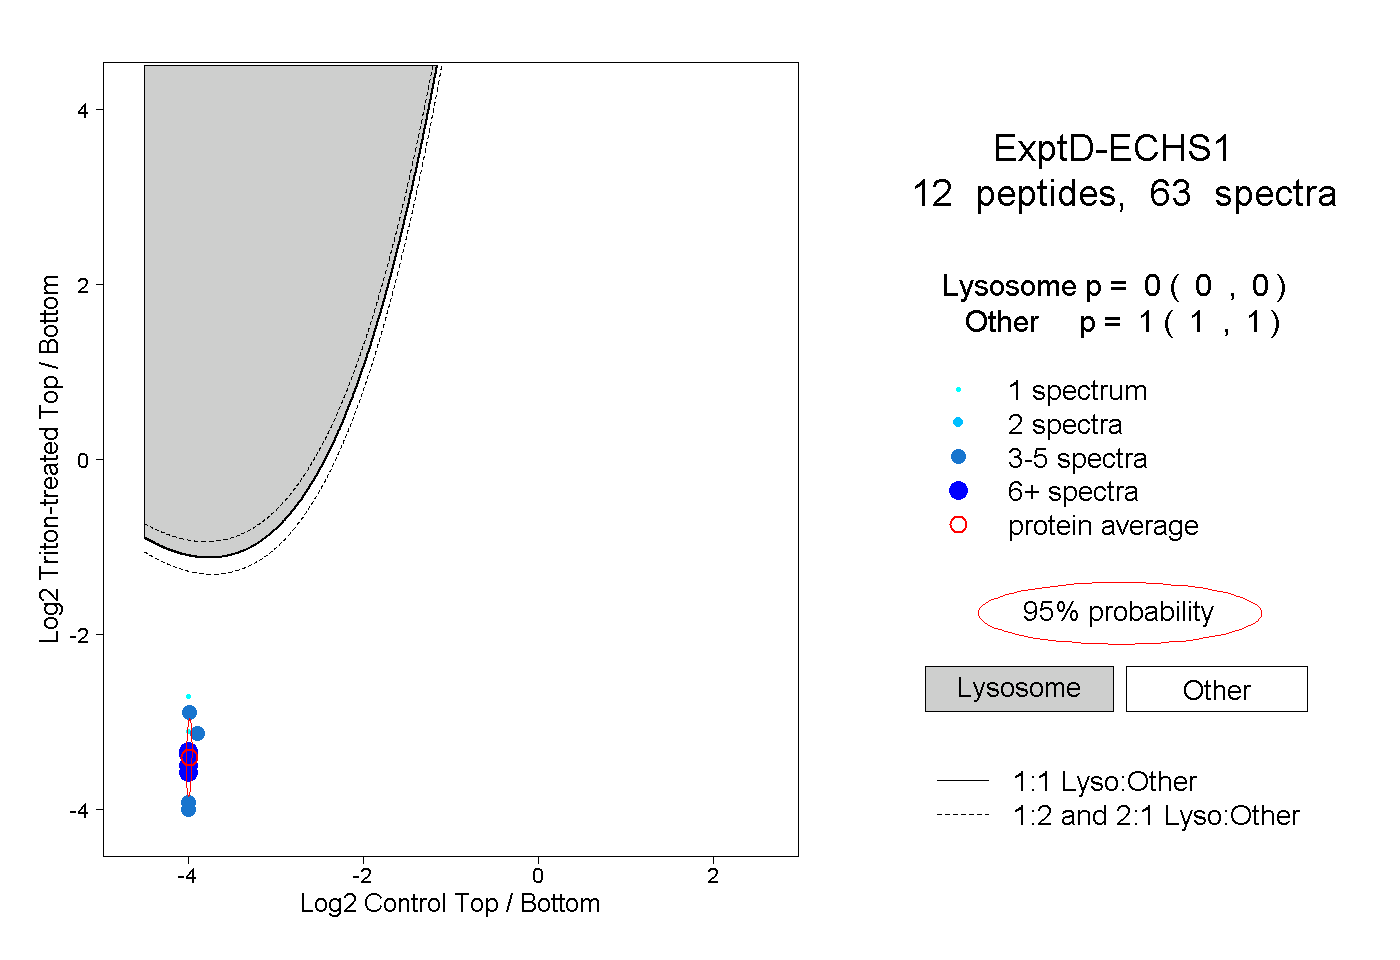
12peptides
spectra

0.986 | 0.989
0.000 | 0.000
0.000 | 0.000
0.000 | 0.000
0.000 | 0.000
0.000 | 0.000
0.010 | 0.014