 13
13peptides
spectra
0.977 | 0.980
0.000 | 0.000
0.000 | 0.000
0.000 | 0.000
0.000 | 0.000
0.000 | 0.000
0.000 | 0.000
0.020 | 0.023
| Plot | Mito | Lyso | Perox | ER | Golgi | PM | Cytosol | Nucleus | |||||
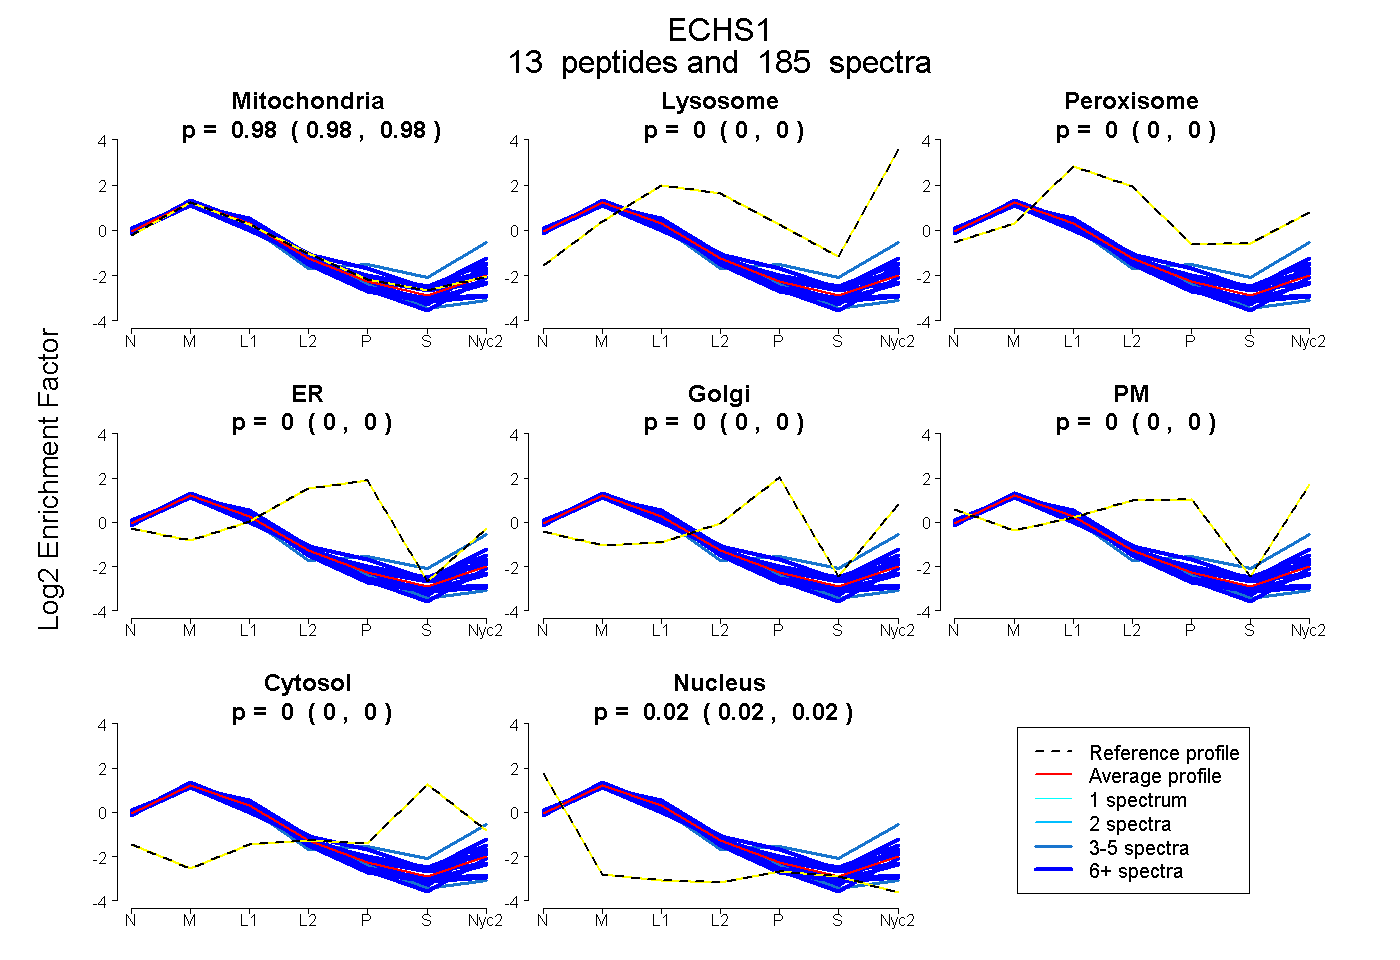
| Expt A |
13 peptides |
185 spectra |
|
0.978 0.977 | 0.980 |
0.000 0.000 | 0.000 |
0.000 0.000 | 0.000 |
0.000 0.000 | 0.000 |
0.000 0.000 | 0.000 |
0.000 0.000 | 0.000 |
0.000 0.000 | 0.000 |
0.022 0.020 | 0.023 |
| 15 spectra, NSSVGLIQLNRPK | 0.985 | 0.000 | 0.000 | 0.000 | 0.000 | 0.000 | 0.000 | 0.015 | ||
| 12 spectra, QAGLVSK | 0.933 | 0.000 | 0.000 | 0.000 | 0.000 | 0.000 | 0.000 | 0.067 | ||
| 13 spectra, AFAAGADIK | 0.906 | 0.067 | 0.000 | 0.000 | 0.000 | 0.000 | 0.000 | 0.027 | ||
| 48 spectra, SLAMEMVLTGDR | 1.000 | 0.000 | 0.000 | 0.000 | 0.000 | 0.000 | 0.000 | 0.000 | ||
| 6 spectra, IANNSK | 0.962 | 0.000 | 0.000 | 0.000 | 0.000 | 0.014 | 0.000 | 0.024 | ||
| 5 spectra, ESVNAAFEMTLTEGNK | 0.706 | 0.176 | 0.000 | 0.000 | 0.028 | 0.000 | 0.019 | 0.071 | ||
| 9 spectra, TFQDCYSGK | 0.925 | 0.000 | 0.000 | 0.000 | 0.000 | 0.000 | 0.000 | 0.075 | ||
| 3 spectra, IFPVETLVEEAIQCAEK | 0.941 | 0.000 | 0.000 | 0.000 | 0.000 | 0.000 | 0.000 | 0.059 | ||
| 6 spectra, LFYSTFATDDR | 0.812 | 0.105 | 0.000 | 0.000 | 0.000 | 0.004 | 0.000 | 0.079 | ||
| 19 spectra, EGMSAFVEK | 0.964 | 0.000 | 0.000 | 0.000 | 0.000 | 0.000 | 0.000 | 0.036 | ||
| 21 spectra, FLSHWDHITR | 0.908 | 0.000 | 0.029 | 0.020 | 0.035 | 0.005 | 0.000 | 0.003 | ||
| 22 spectra, IIVAMAK | 0.944 | 0.000 | 0.000 | 0.000 | 0.016 | 0.017 | 0.011 | 0.012 | ||
| 6 spectra, ISAQDAK | 0.972 | 0.000 | 0.000 | 0.000 | 0.000 | 0.000 | 0.000 | 0.028 |
| Plot | Mito | Lyso or Perox | ER | Golgi | PM | Cytosol | Nucleus | ||||||
| Expt B |
12 peptides |
112 spectra |
 |
0.988 0.986 | 0.989 |
0.000 0.000 | 0.000 |
0.000 0.000 | 0.000 |
0.000 0.000 | 0.000 |
0.000 0.000 | 0.000 |
0.000 0.000 | 0.000 |
0.012 0.010 | 0.014 |
|||
| Plot | Lyso | Other | |||||||||||
| Expt C |
14 peptides |
1028 spectra |
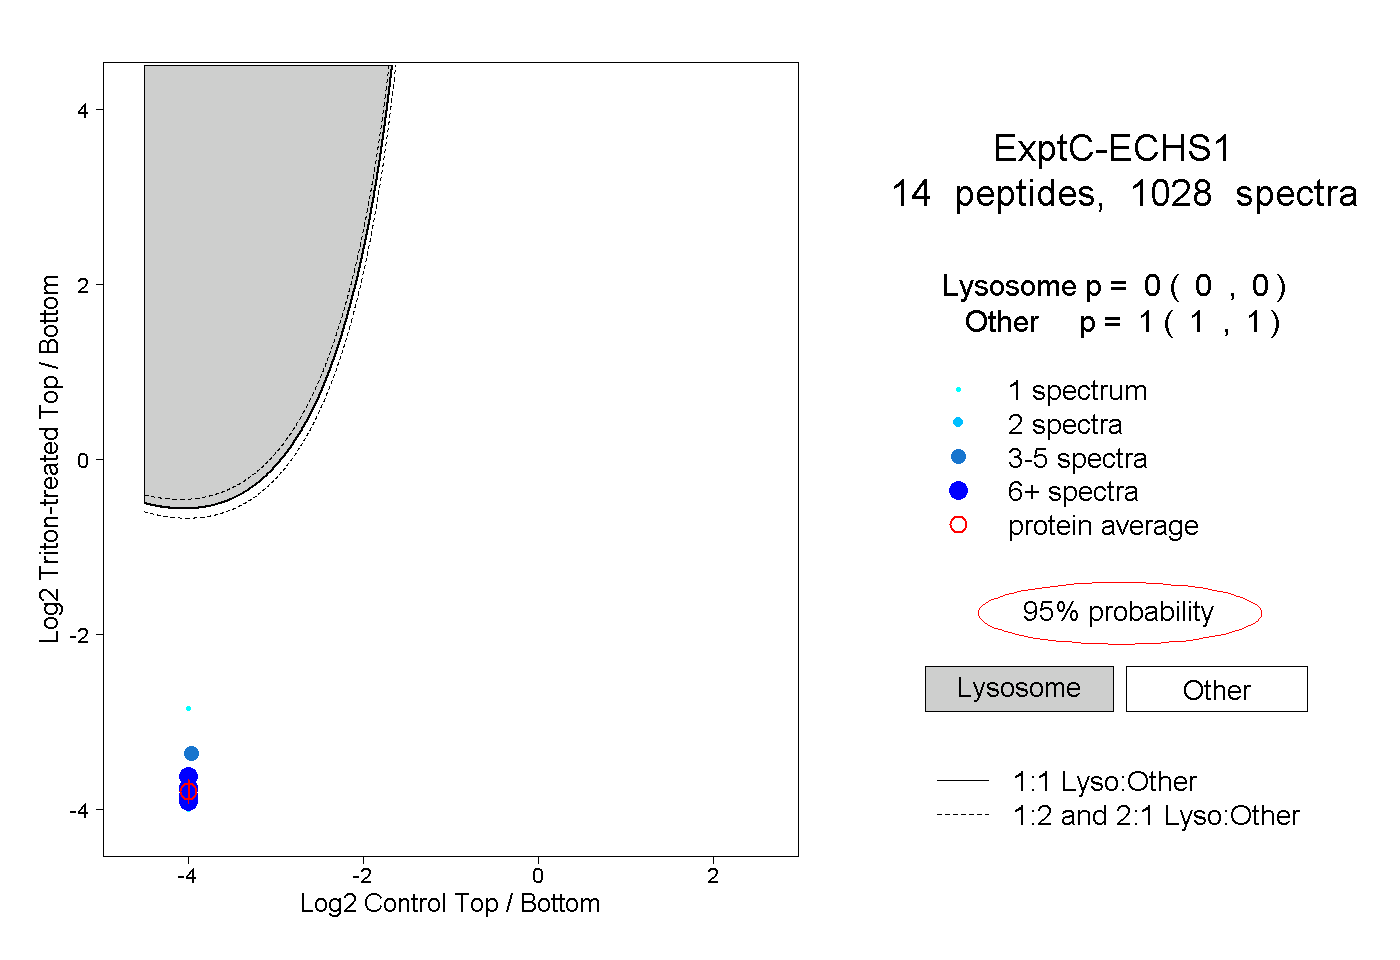 |
0.000 0.000 | 0.000 |
1.000 1.000 | 1.000 |
||||||||
| Plot | Lyso | Other | |||||||||||
| Expt D |
12 peptides |
63 spectra |
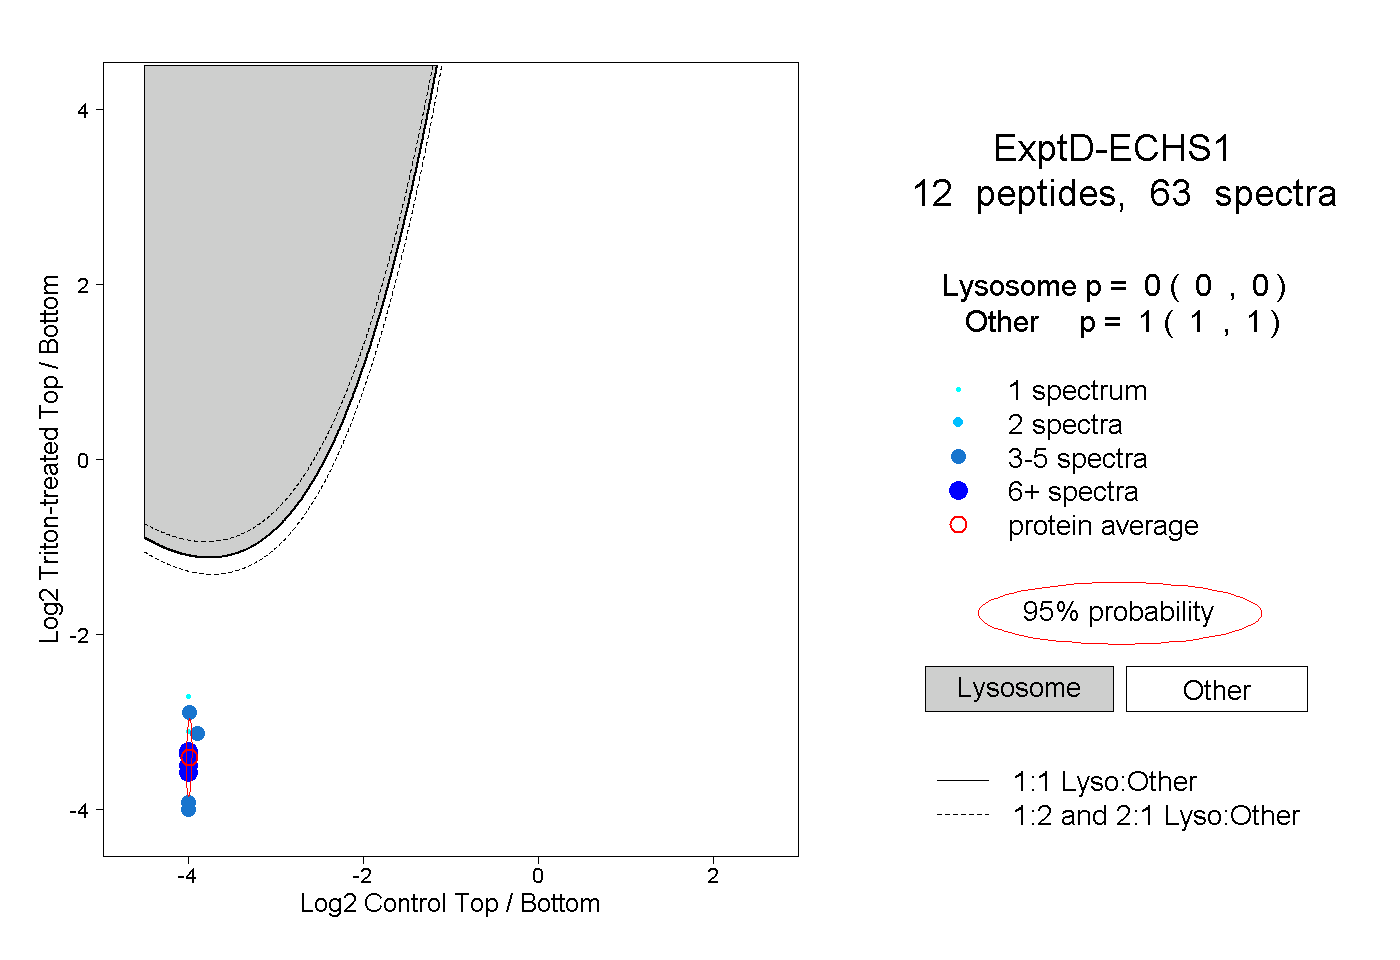 |
0.000 0.000 | 0.000 |
1.000 1.000 | 1.000 |