 1
1peptide
spectrum
NA | NA
NA | NA
NA | NA
NA | NA
NA | NA
NA | NA
NA | NA
NA | NA
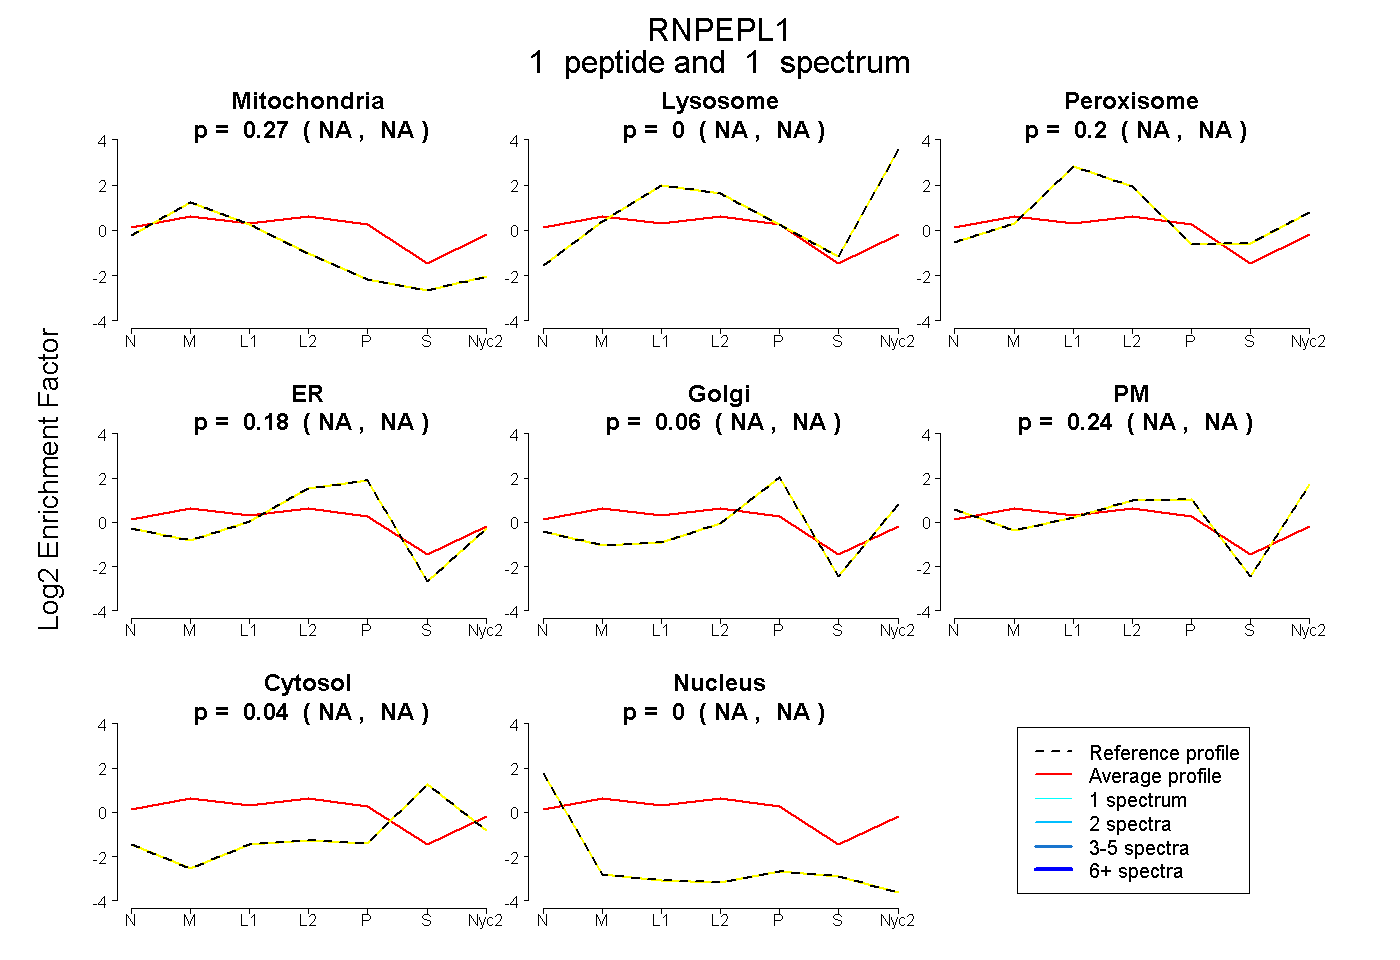
| Plot | Mito | Lyso | Perox | ER | Golgi | PM | Cytosol | Nucleus | |||||
| Expt A |
1 peptide |
1 spectrum |
|
0.275 NA | NA |
0.000 NA | NA |
0.204 NA | NA |
0.183 NA | NA |
0.059 NA | NA |
0.236 NA | NA |
0.044 NA | NA |
0.000 NA | NA |
| 1 spectrum, LHPNLR | 0.275 | 0.000 | 0.204 | 0.183 | 0.059 | 0.236 | 0.044 | 0.000 |