PLIN3
[ENSRNOP00000066344]
Main page
| | | Plot |
Mito |
Lyso |
|
Perox |
ER |
Golgi |
PM |
Cytosol |
Nucleus |
|
| Expt A |
 11
11
peptides |
28
spectra |
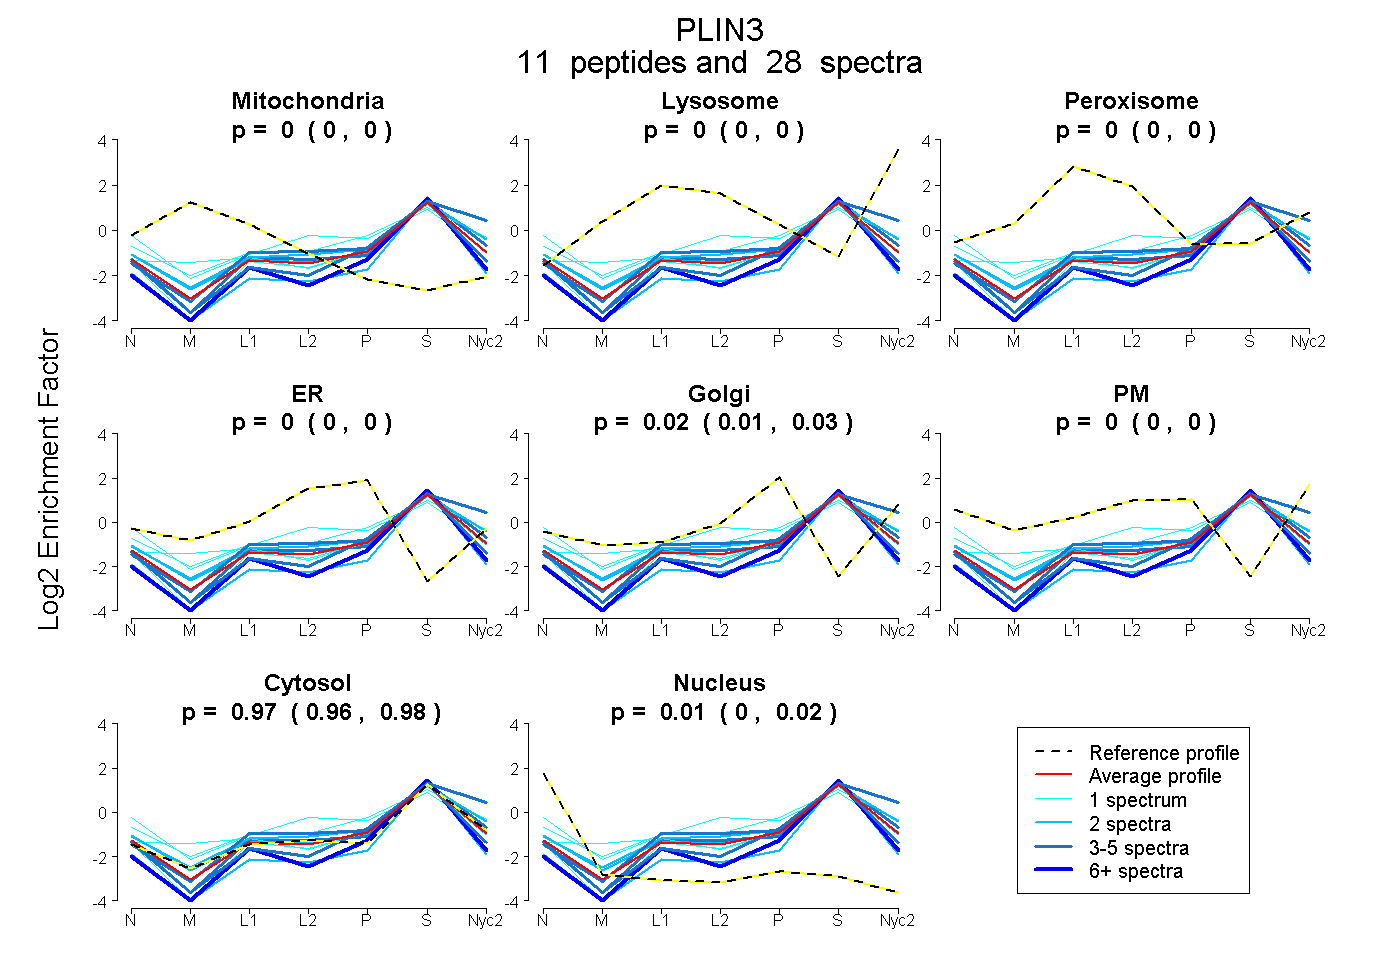 |
0.000
0.000 | 0.000 |
0.000
0.000 | 0.000 |
|
0.000
0.000 | 0.000 |
0.000
0.000 | 0.000 |
0.018
0.009 | 0.026 |
0.000
0.000 | 0.000 |
0.970
0.962 | 0.976 |
0.013
0.004 | 0.020 |
|
| | | Plot |
Mito |
|
Lyso or Perox |
|
ER |
Golgi |
PM |
Cytosol |
Nucleus |
|
| Expt B |
3
peptides |
7
spectra |
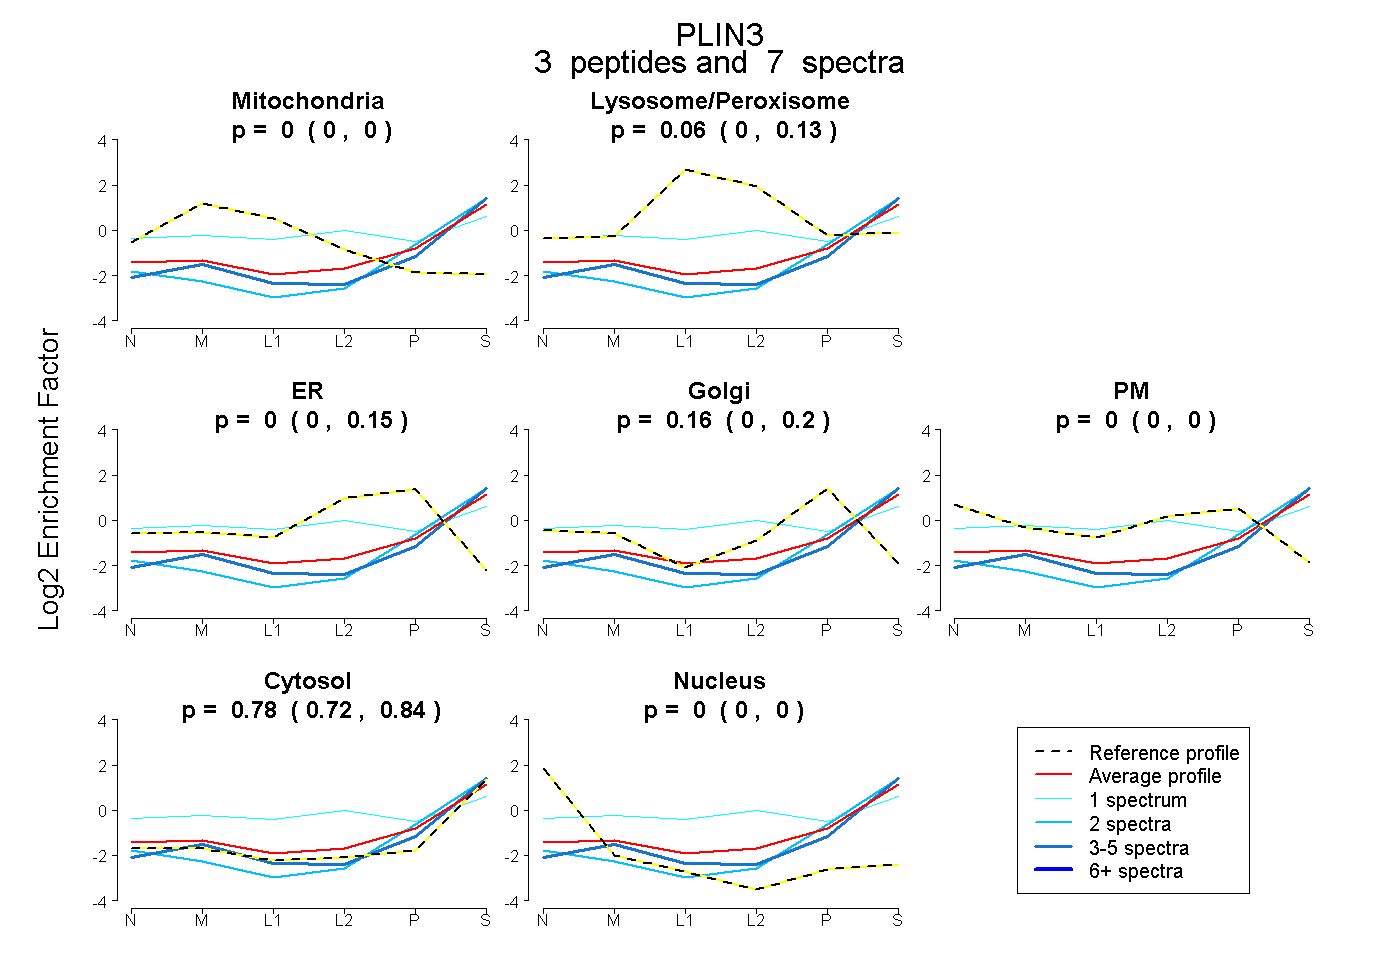 |
0.000
0.000 | 0.000 |
|
0.058
0.000 | 0.126 |
|
0.000
0.000 | 0.148 |
0.158
0.000 | 0.201 |
0.000
0.000 | 0.002 |
0.784
0.725 | 0.841 |
0.000
0.000 | 0.000 |
|
| 1 spectrum, AQPILSK |
0.000 |
|
0.347 |
|
0.000 |
0.000 |
0.247 |
0.407 |
0.000 |
|
| 4 spectra, VGQMVISGVDR |
0.000 |
|
0.000 |
|
0.000 |
0.041 |
0.000 |
0.959 |
0.000 |
|
| 2 spectra, ELVSSTVSGAR |
0.000 |
|
0.000 |
|
0.000 |
0.083 |
0.000 |
0.917 |
0.000 |
|
| | | Plot |
|
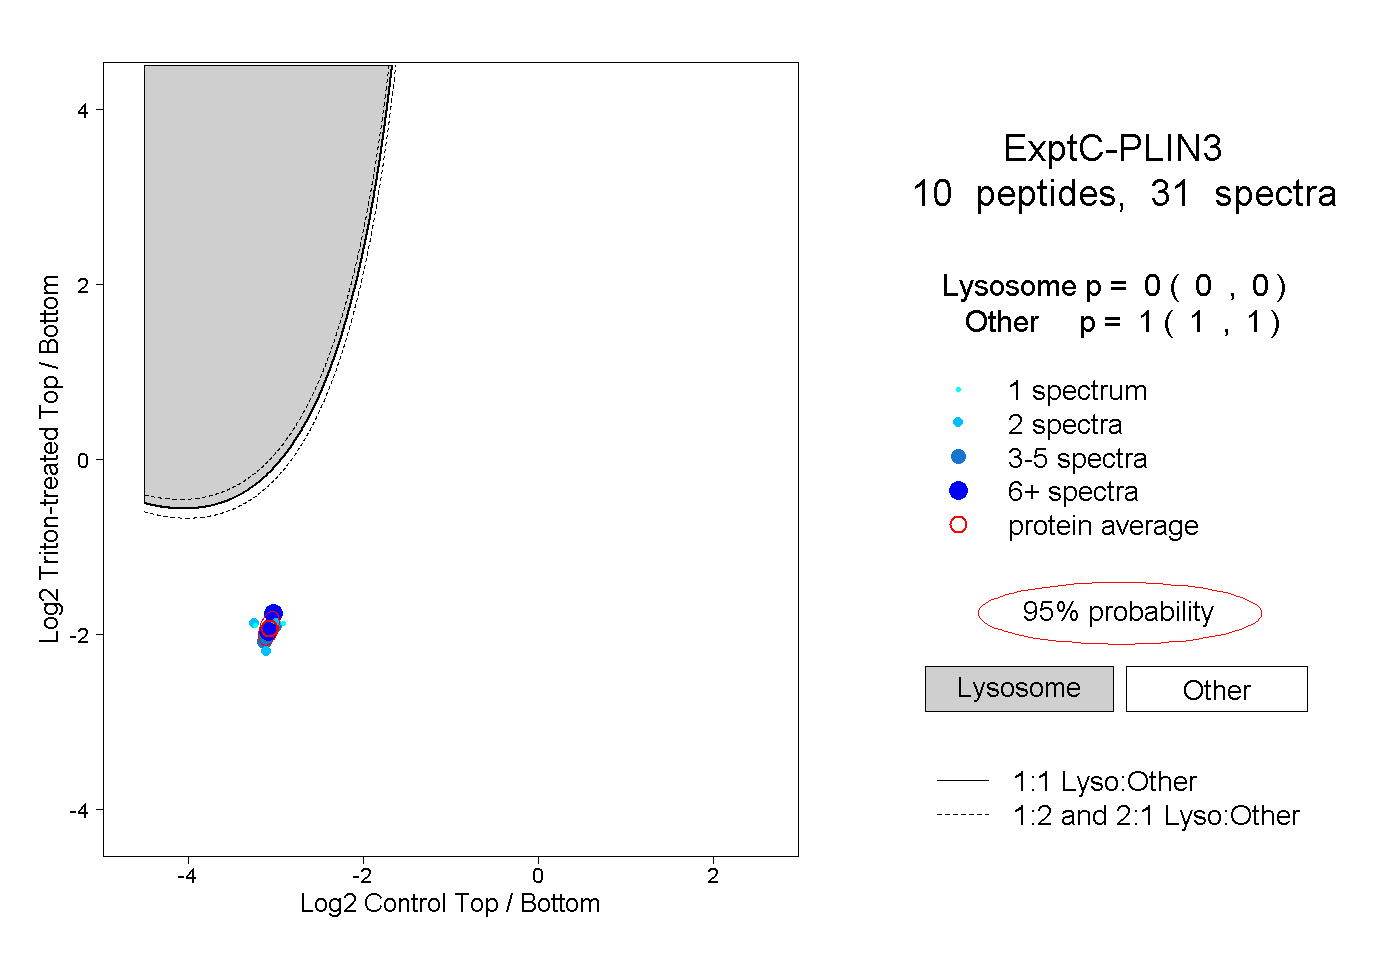
Lyso |
|
|
|
|
|
|
|
Other |
| Expt C |
10
peptides |
31
spectra |
 |
|
0.000
0.000 | 0.000 |
|
|
|
|
|
|
|
1.000
1.000 | 1.000 |
| | | Plot |
|
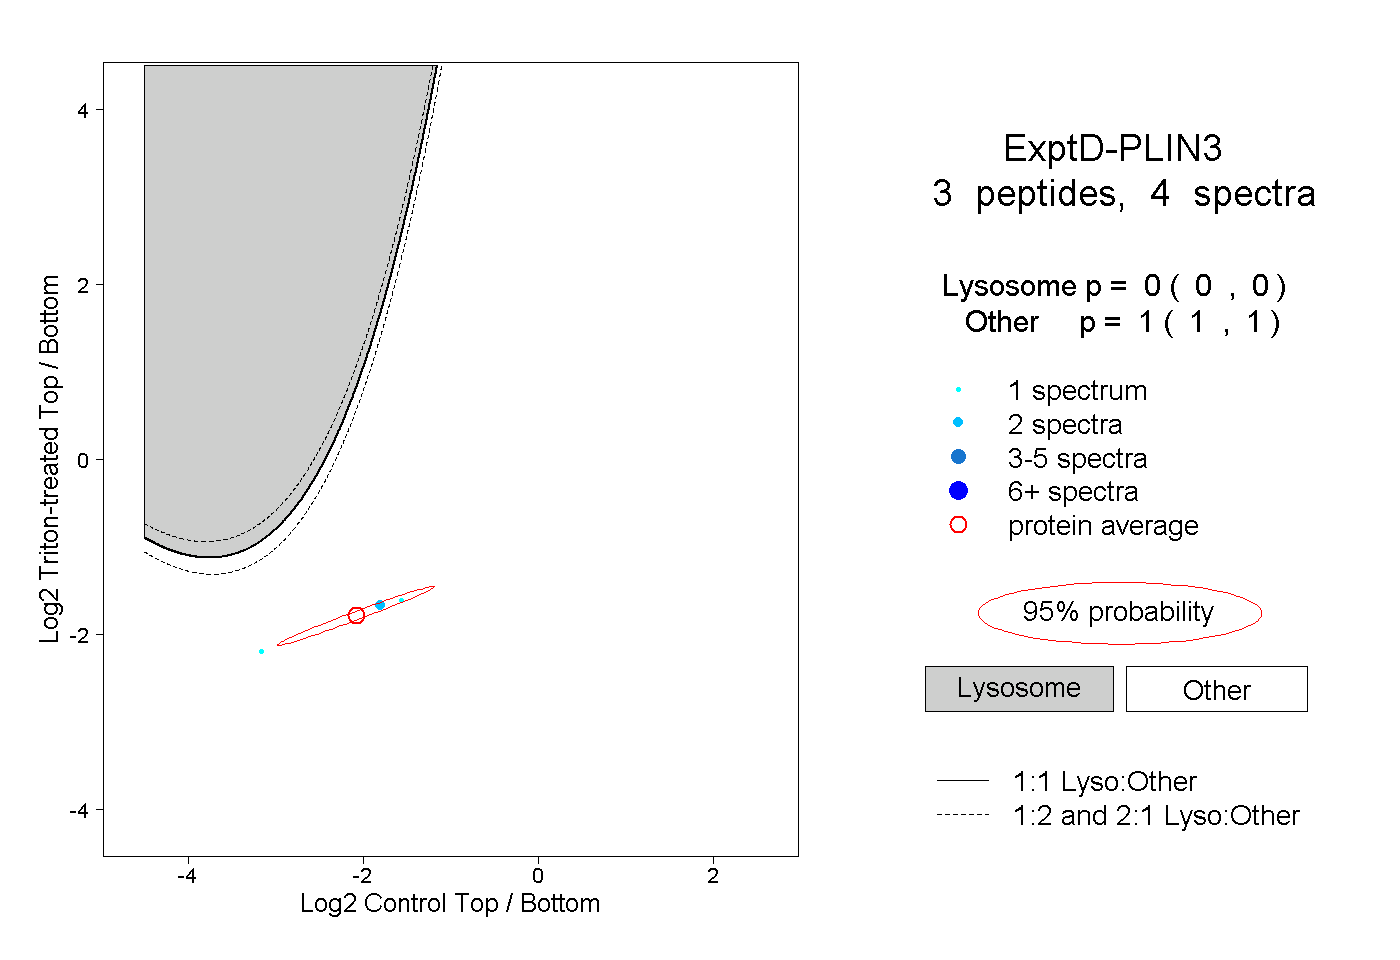
Lyso |
|
|
|
|
|
|
|
Other |
| Expt D |
3
peptides |
4
spectra |
 |
|
0.000
0.000 | 0.000 |
|
|
|
|
|
|
|
1.000
1.000 | 1.000 |