 11
11peptides
spectra
0.000 | 0.000
0.000 | 0.000
0.000 | 0.000
0.000 | 0.000
0.009 | 0.026
0.000 | 0.000
0.962 | 0.976
0.004 | 0.020
| Plot | Mito | Lyso | Perox | ER | Golgi | PM | Cytosol | Nucleus | |||||
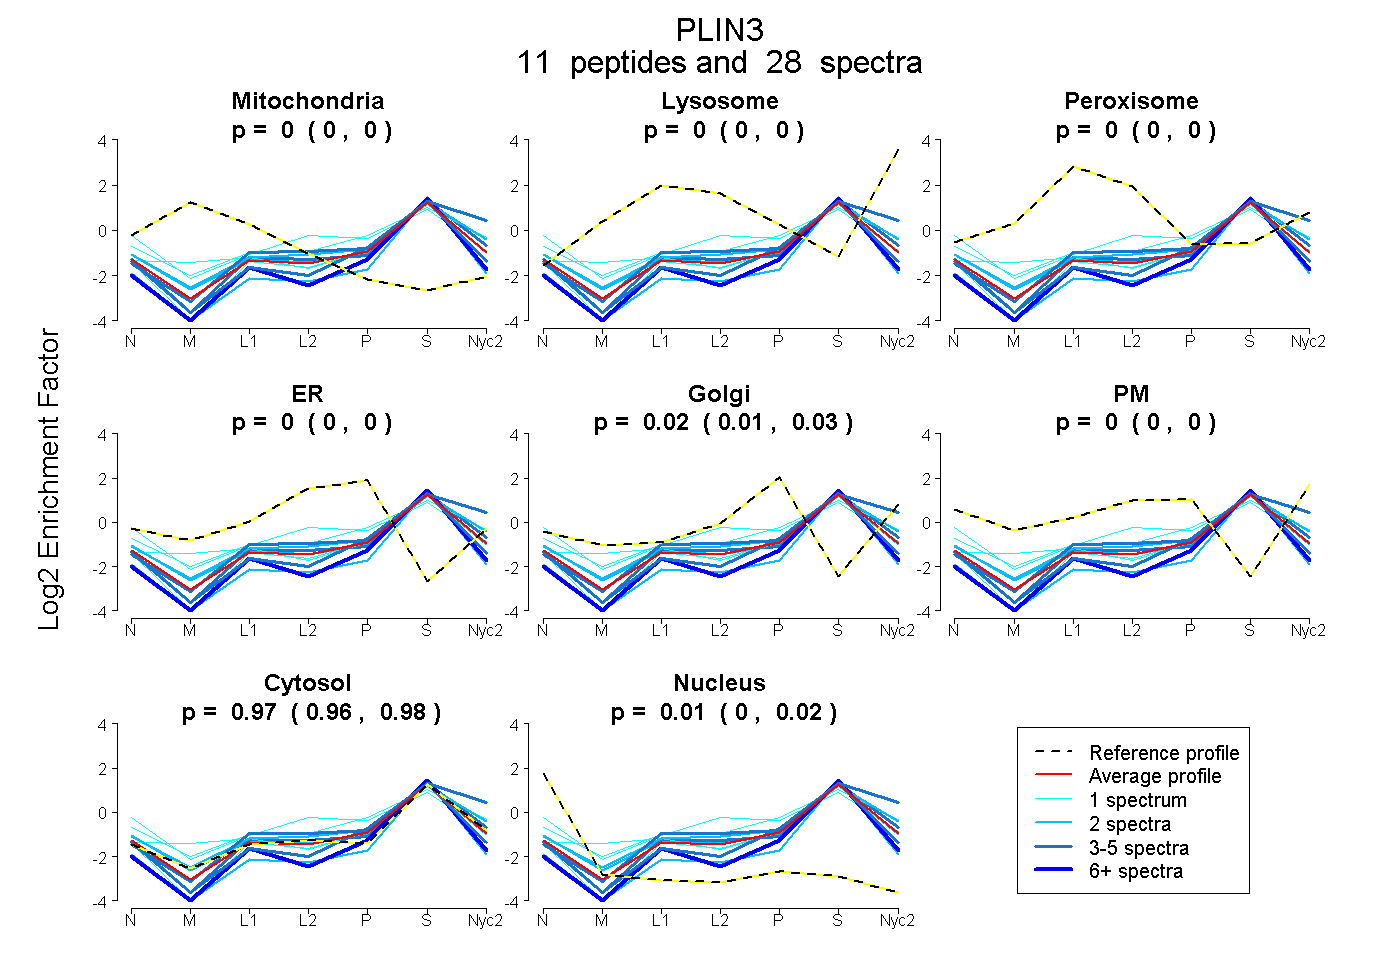
| Expt A |
11 peptides |
28 spectra |
|
0.000 0.000 | 0.000 |
0.000 0.000 | 0.000 |
0.000 0.000 | 0.000 |
0.000 0.000 | 0.000 |
0.018 0.009 | 0.026 |
0.000 0.000 | 0.000 |
0.970 0.962 | 0.976 |
0.013 0.004 | 0.020 |
| 7 spectra, SAMTSGVQSIMGSR | 0.000 | 0.000 | 0.000 | 0.000 | 0.000 | 0.000 | 0.936 | 0.064 | ||
| 3 spectra, TVCDVAEK | 0.000 | 0.130 | 0.000 | 0.000 | 0.000 | 0.000 | 0.870 | 0.000 | ||
| 1 spectrum, LEPQIVTANK | 0.000 | 0.000 | 0.000 | 0.000 | 0.000 | 0.000 | 0.945 | 0.055 | ||
| 1 spectrum, LEEGQEK | 0.000 | 0.000 | 0.042 | 0.000 | 0.144 | 0.061 | 0.752 | 0.000 | ||
| 1 spectrum, ESYPHVR | 0.000 | 0.000 | 0.035 | 0.215 | 0.000 | 0.006 | 0.732 | 0.011 | ||
| 1 spectrum, NQAYEHSLGK | 0.123 | 0.000 | 0.000 | 0.000 | 0.027 | 0.000 | 0.850 | 0.000 | ||
| 2 spectra, QGVDQR | 0.000 | 0.017 | 0.000 | 0.000 | 0.032 | 0.055 | 0.896 | 0.000 | ||
| 2 spectra, DTVATR | 0.000 | 0.000 | 0.000 | 0.002 | 0.035 | 0.000 | 0.940 | 0.023 | ||
| 4 spectra, VGQMVISGVDR | 0.000 | 0.000 | 0.000 | 0.000 | 0.000 | 0.000 | 0.936 | 0.064 | ||
| 4 spectra, EQAQQAR | 0.000 | 0.000 | 0.000 | 0.000 | 0.000 | 0.000 | 1.000 | 0.000 | ||
| 2 spectra, ELVSSTVSGAR | 0.000 | 0.000 | 0.000 | 0.000 | 0.000 | 0.000 | 0.894 | 0.106 |
| Plot | Mito | Lyso or Perox | ER | Golgi | PM | Cytosol | Nucleus | ||||||
| Expt B |
3 peptides |
7 spectra |
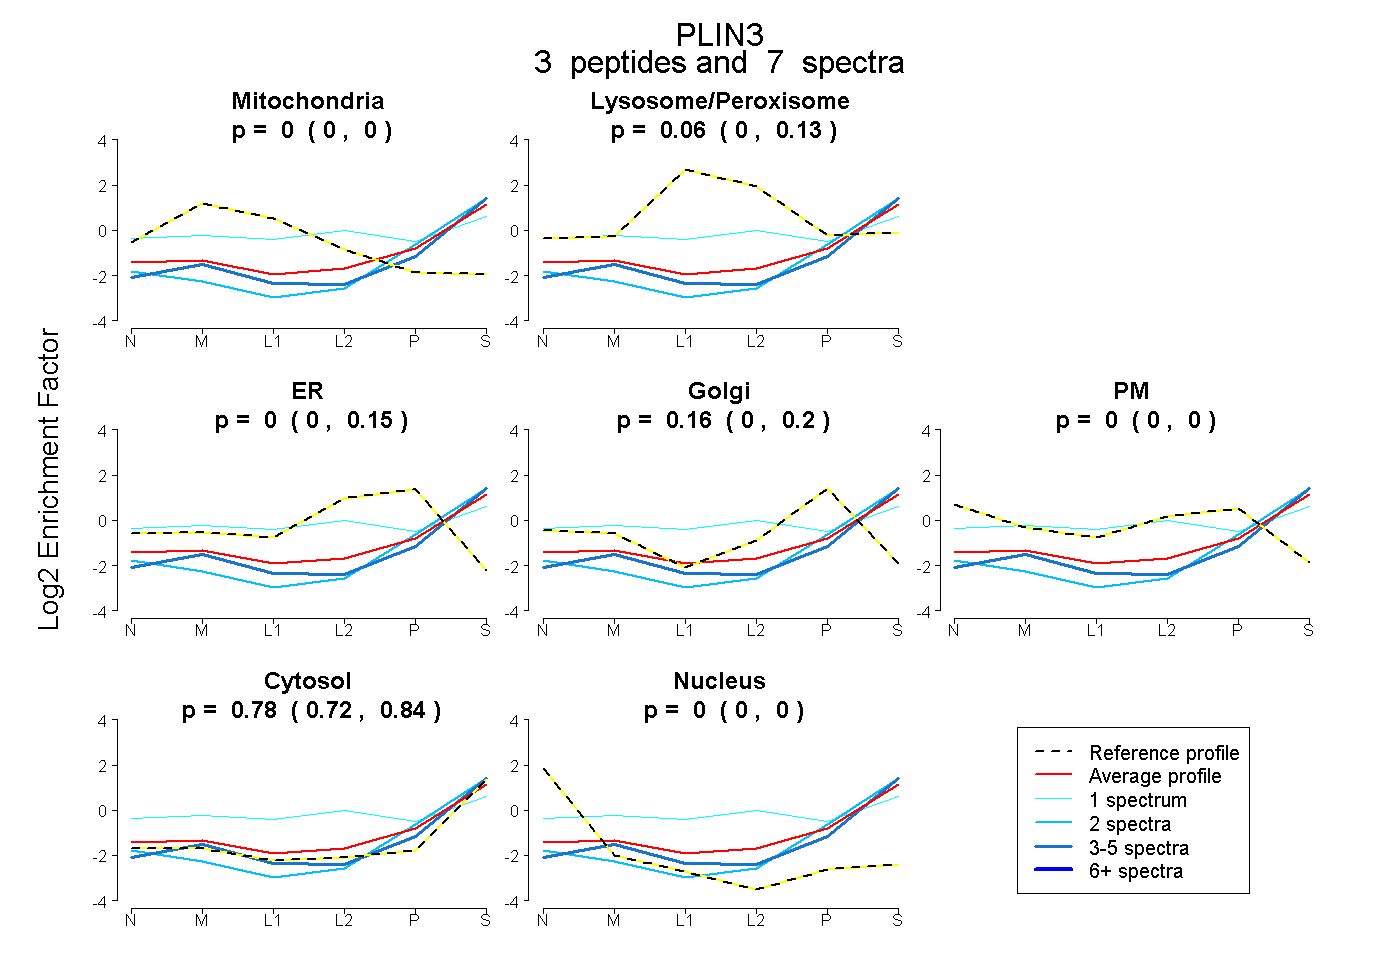 |
0.000 0.000 | 0.000 |
0.058 0.000 | 0.126 |
0.000 0.000 | 0.148 |
0.158 0.000 | 0.201 |
0.000 0.000 | 0.002 |
0.784 0.725 | 0.841 |
0.000 0.000 | 0.000 |
|||
| Plot | Lyso | Other | |||||||||||
| Expt C |
10 peptides |
31 spectra |
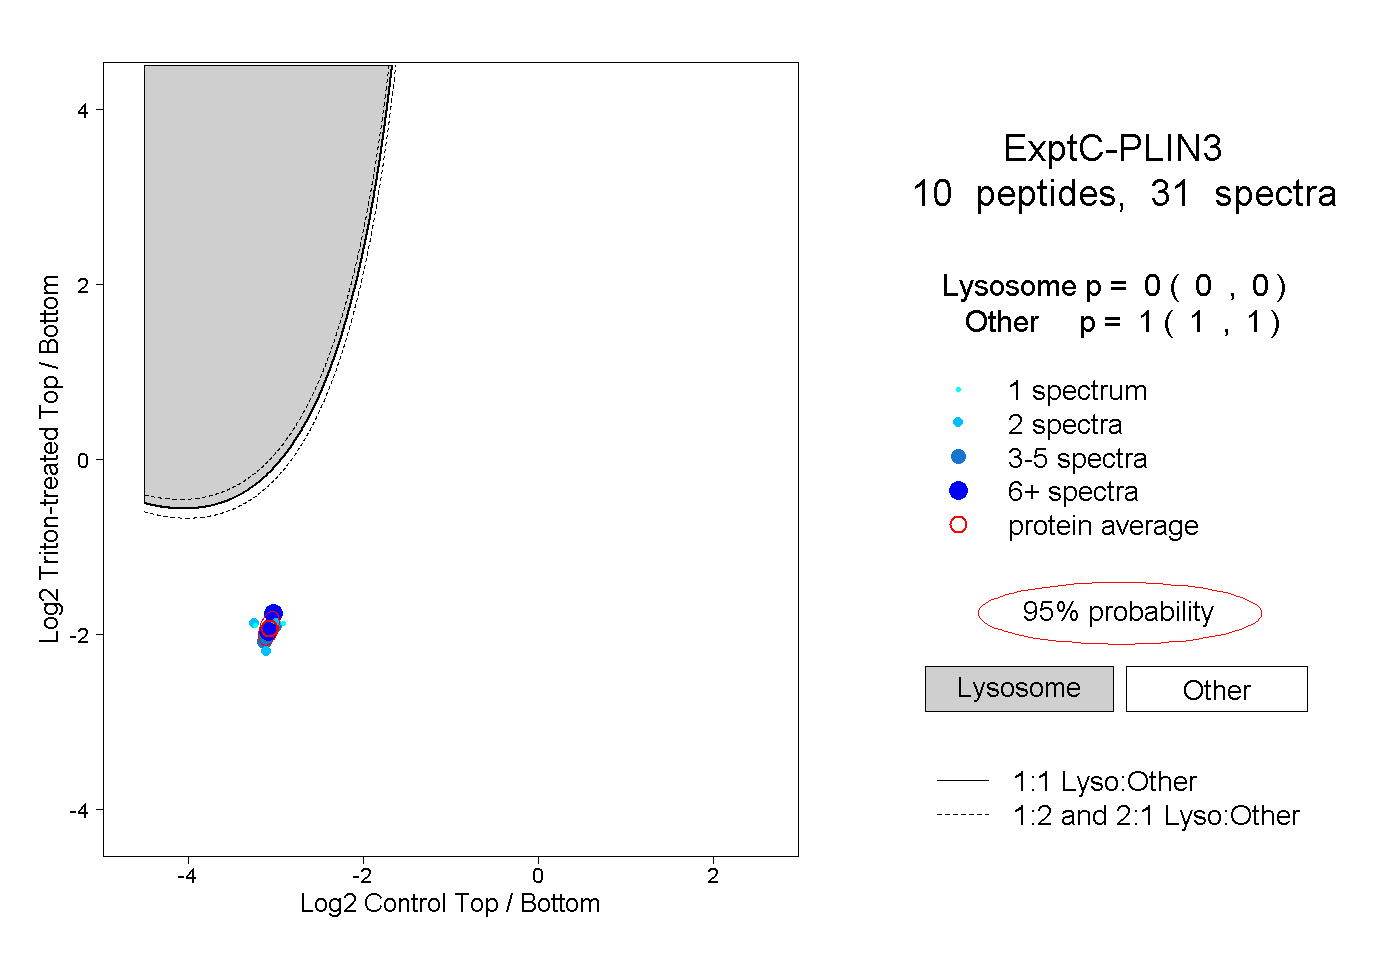 |
0.000 0.000 | 0.000 |
1.000 1.000 | 1.000 |
||||||||
| Plot | Lyso | Other | |||||||||||
| Expt D |
3 peptides |
4 spectra |
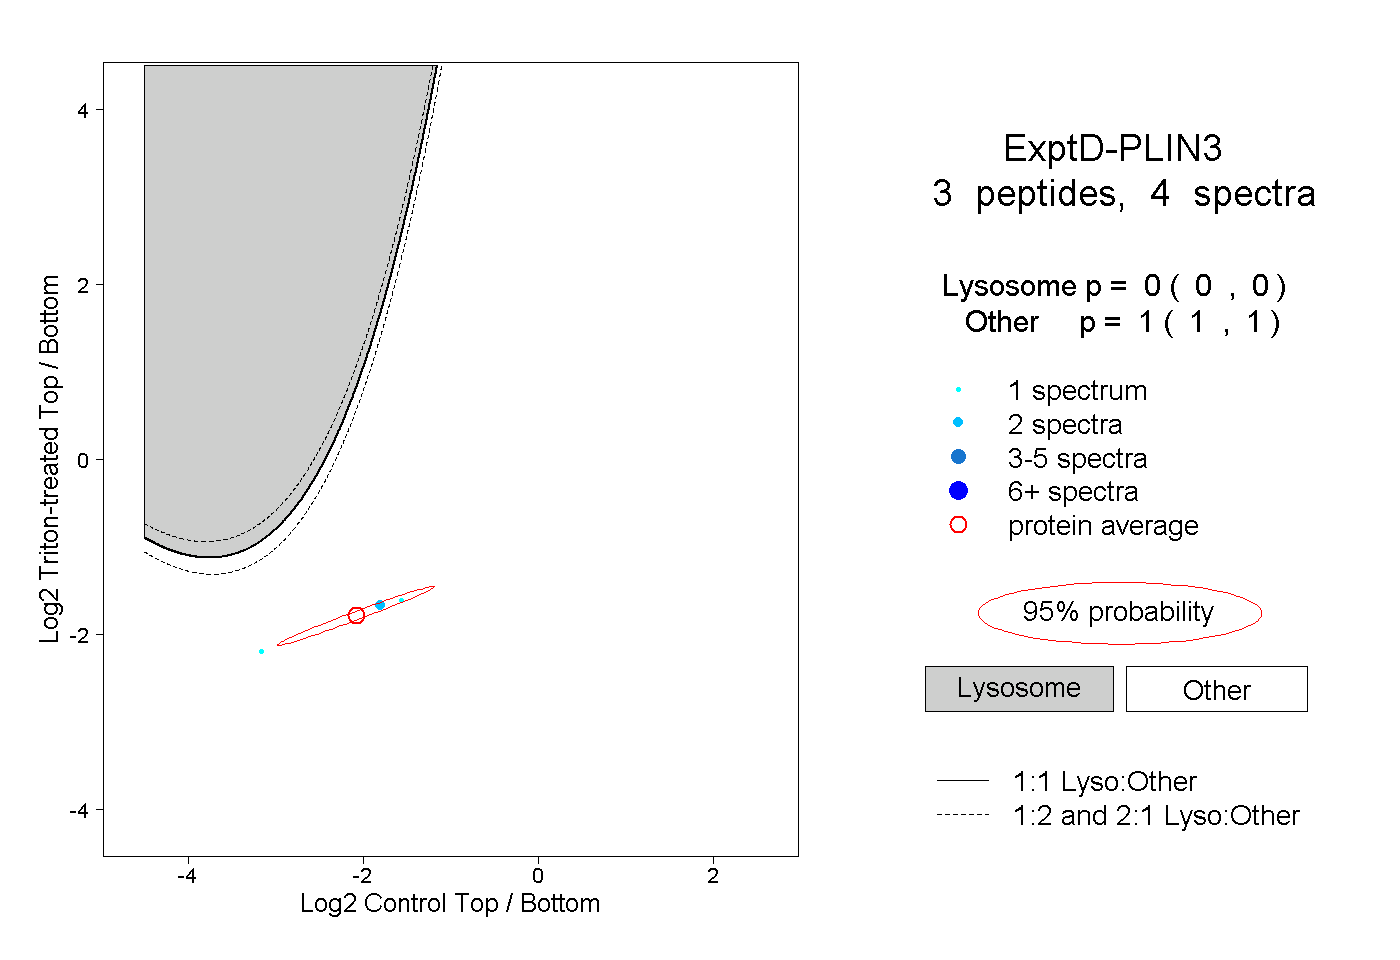 |
0.000 0.000 | 0.000 |
1.000 1.000 | 1.000 |