 2
2peptides
spectra
0.000 | 0.000
0.000 | 0.000
0.295 | 0.424
0.000 | 0.060
0.000 | 0.000
0.185 | 0.334
0.291 | 0.389
0.000 | 0.039
2peptides
spectra
0.000 | 0.000
1.000 | 1.000
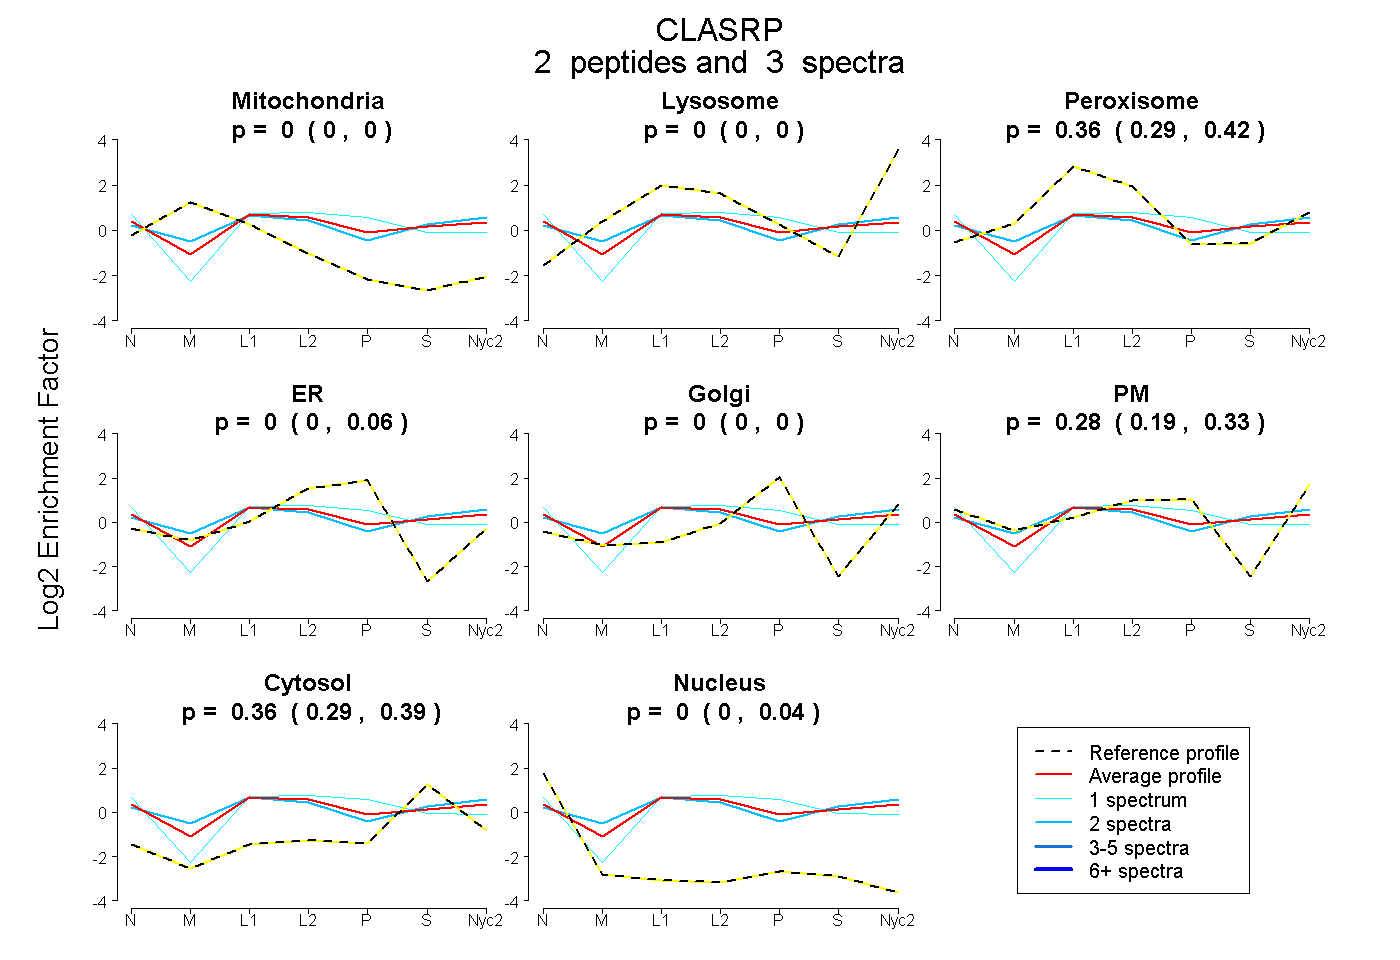
| Plot | Mito | Lyso | Perox | ER | Golgi | PM | Cytosol | Nucleus | |||||
| Expt A |
2 peptides |
3 spectra |
|
0.000 0.000 | 0.000 |
0.000 0.000 | 0.000 |
0.358 0.295 | 0.424 |
0.000 0.000 | 0.060 |
0.000 0.000 | 0.000 |
0.285 0.185 | 0.334 |
0.357 0.291 | 0.389 |
0.001 0.000 | 0.039 |
||
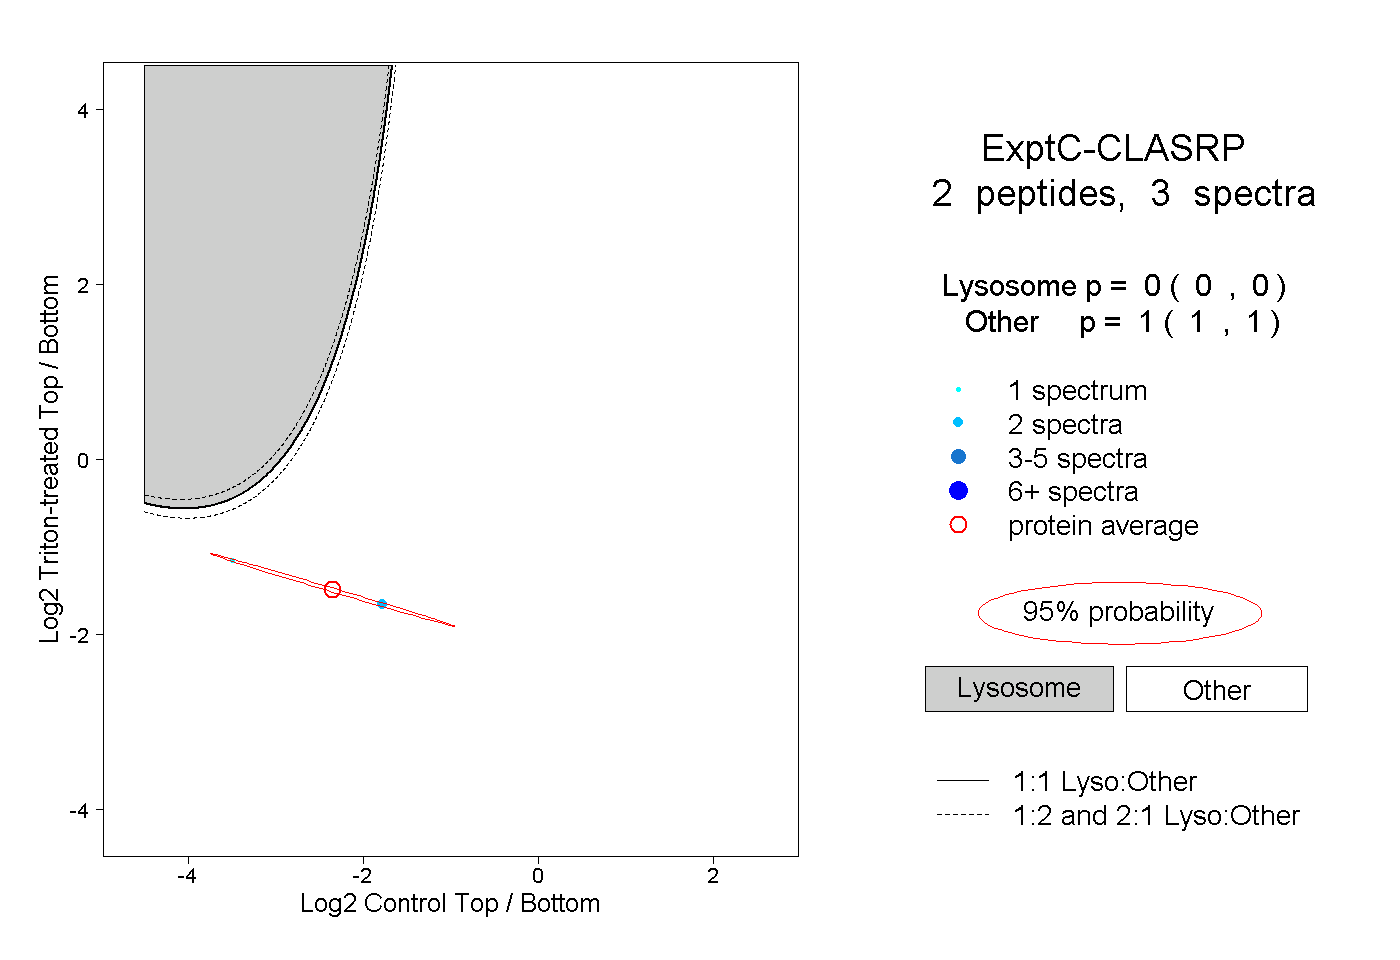
| Plot | Lyso | Other | |||||||||||
| Expt C |
2 peptides |
3 spectra |
|
0.000 0.000 | 0.000 |
1.000 1.000 | 1.000 |