 3
3peptides
spectra
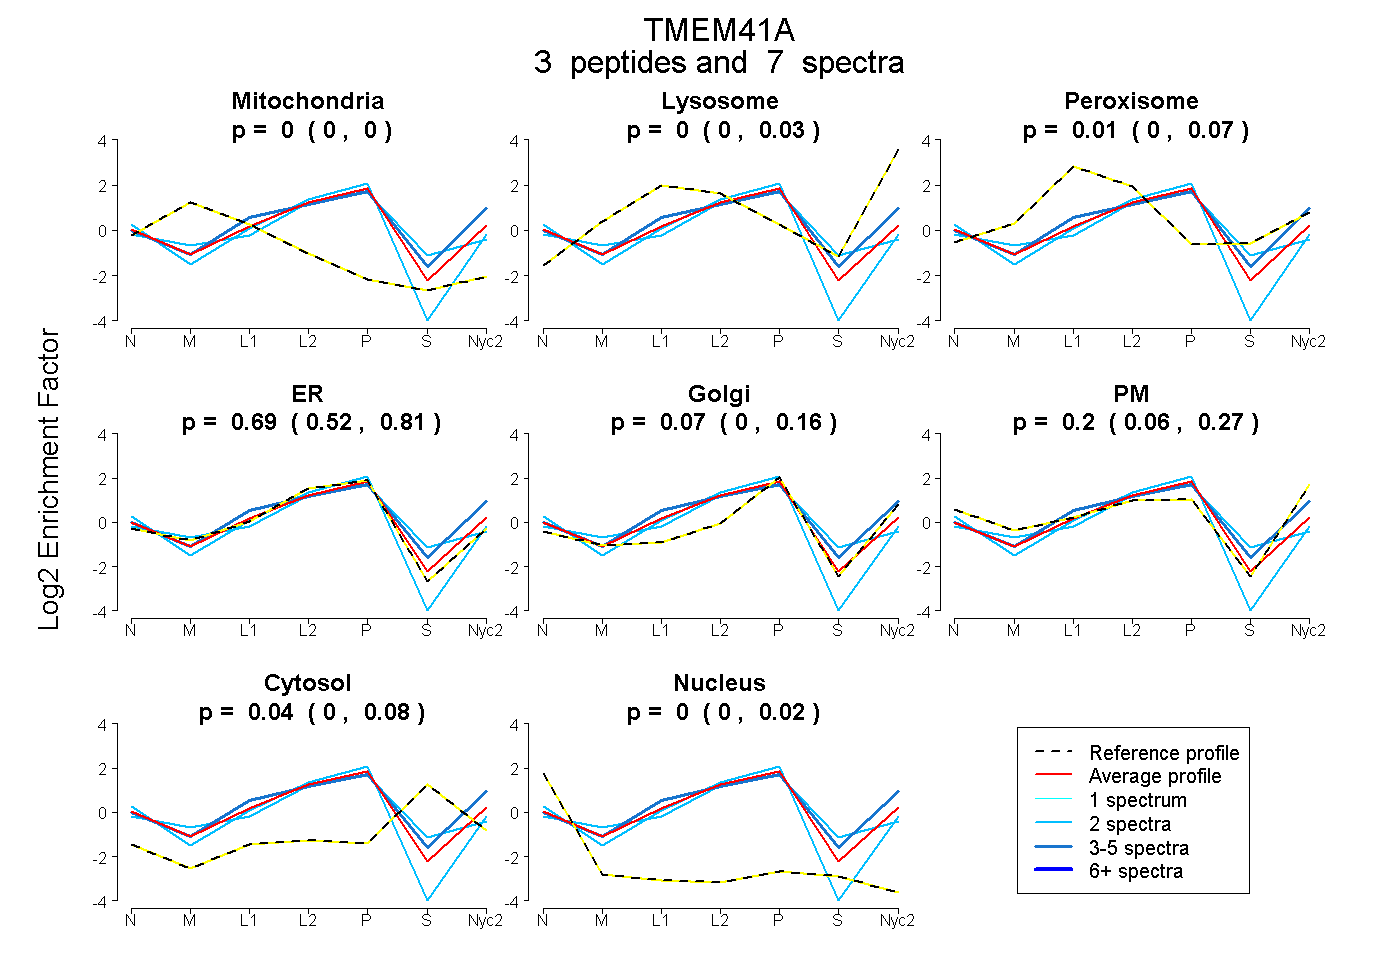
0.000 | 0.000
0.000 | 0.029
0.000 | 0.074
0.523 | 0.811
0.000 | 0.160
0.059 | 0.272
0.000 | 0.084
0.000 | 0.016
2peptides
spectra
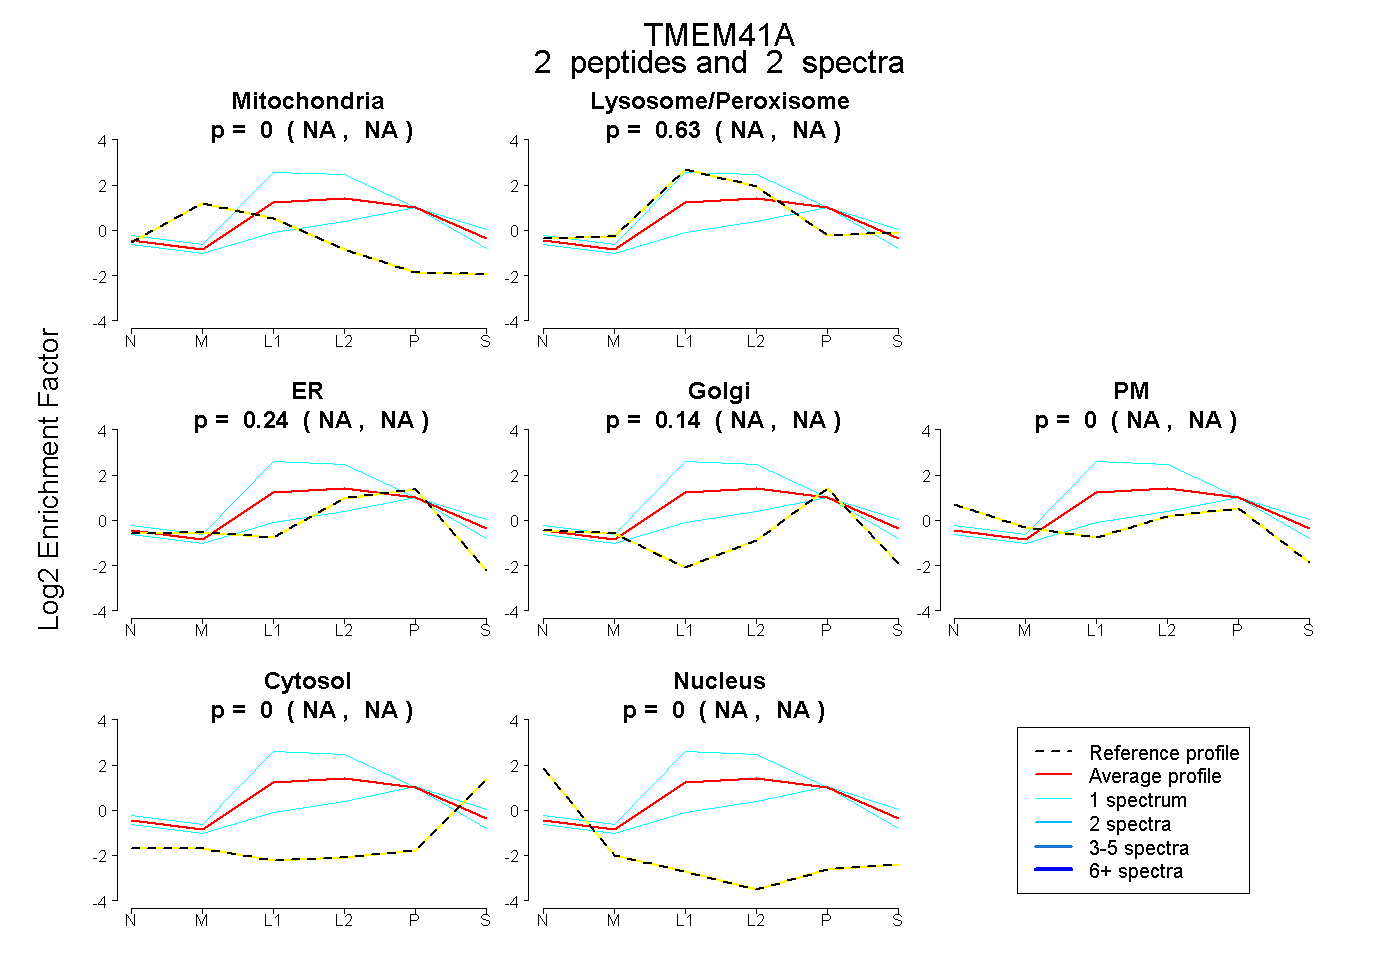
NA | NA
NA | NA
NA | NA
NA | NA
NA | NA
NA | NA
NA | NA
2peptides
spectra
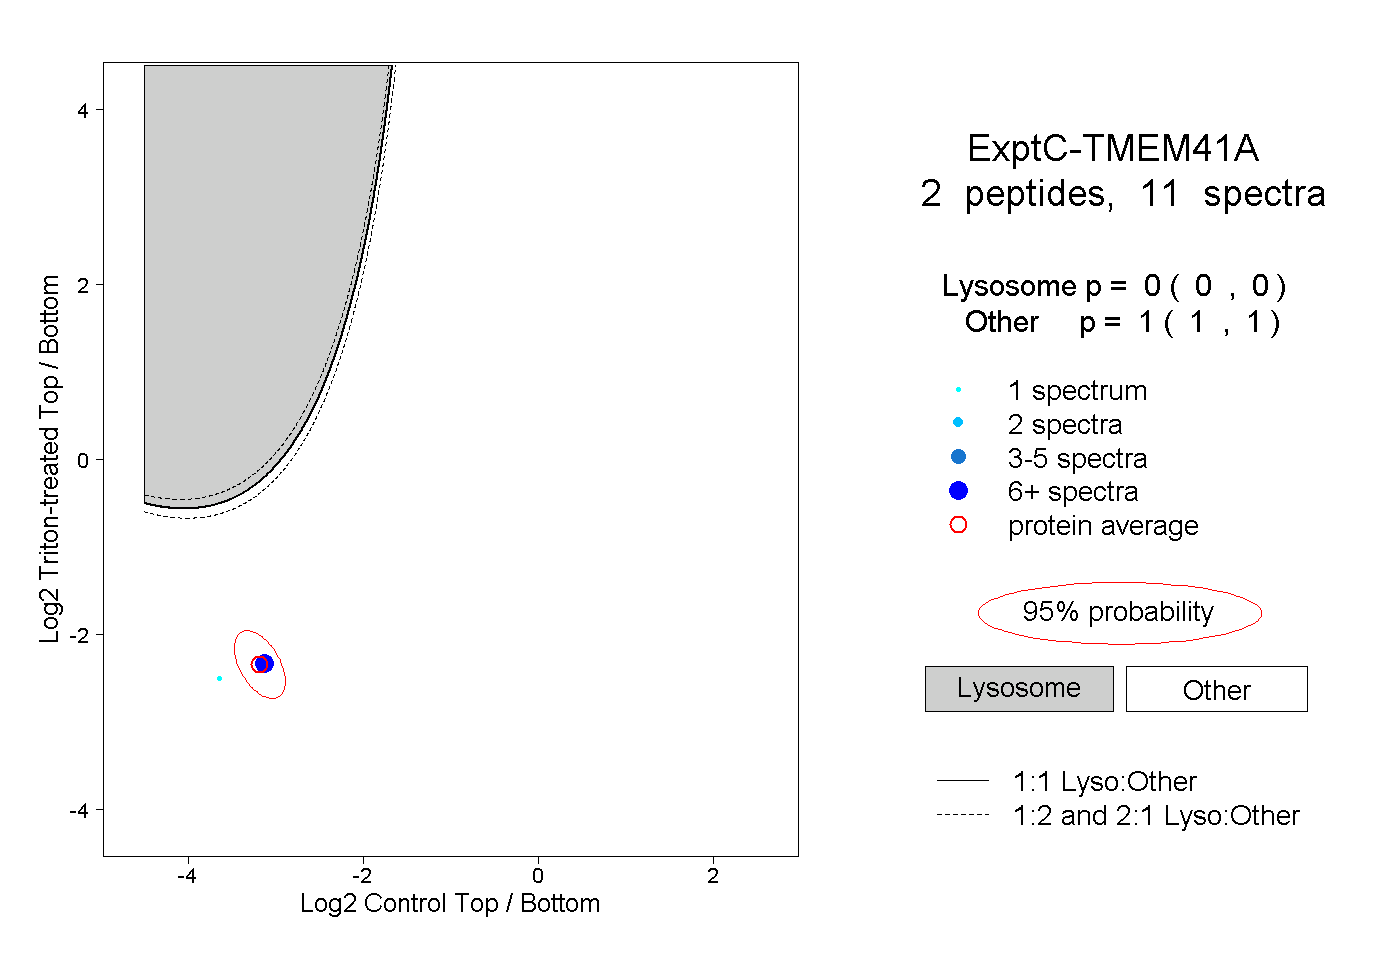
0.000 | 0.000
1.000 | 1.000