 4
4peptides
spectra
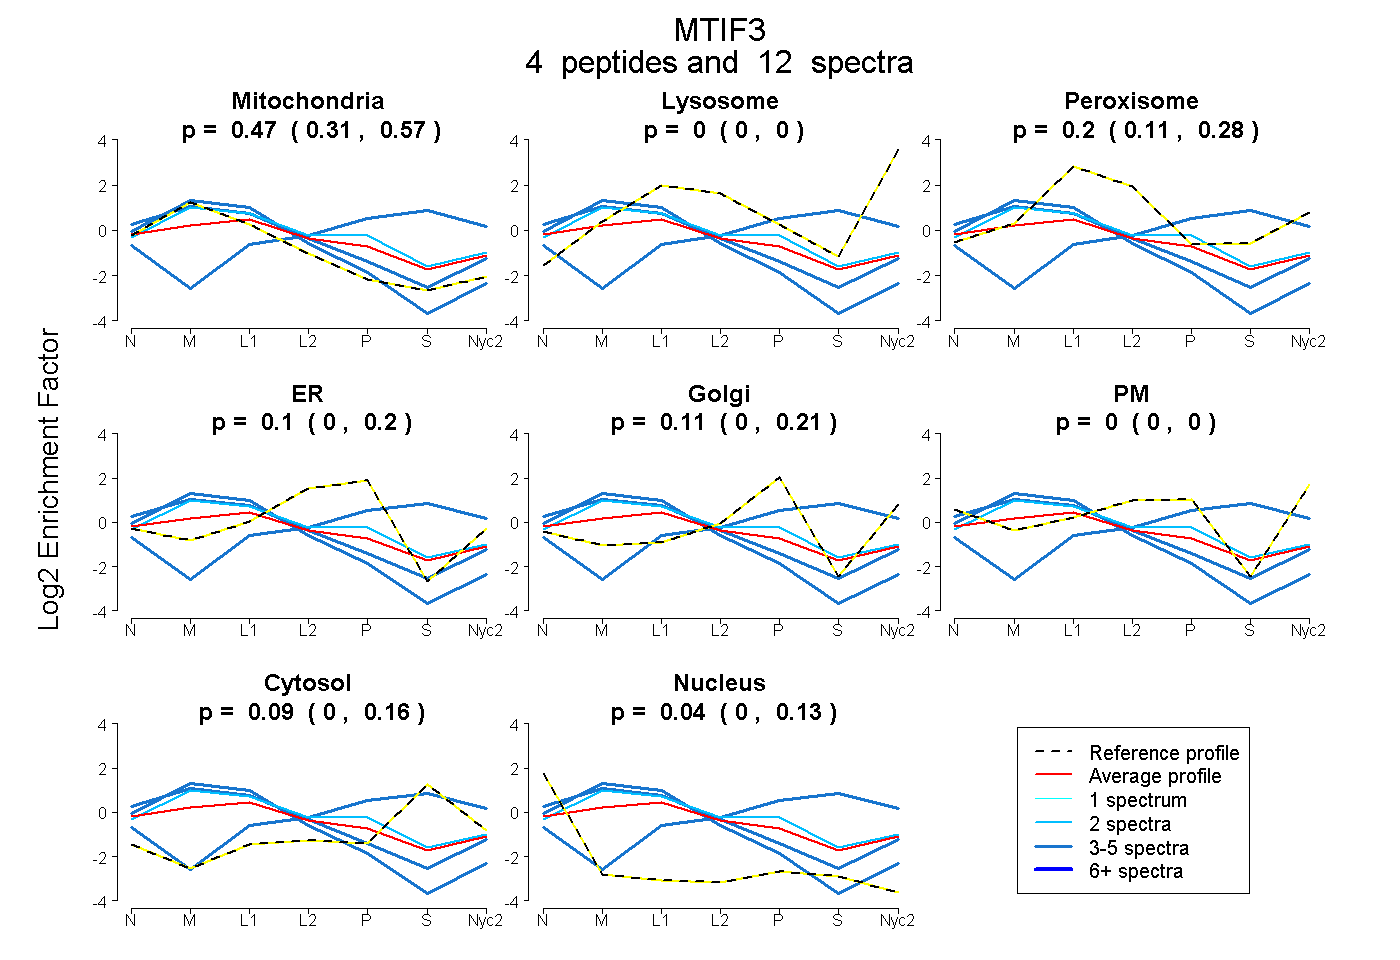
0.308 | 0.570
0.000 | 0.000
0.112 | 0.284
0.000 | 0.205
0.000 | 0.211
0.000 | 0.000
0.000 | 0.163
0.000 | 0.125
1peptide
spectrum
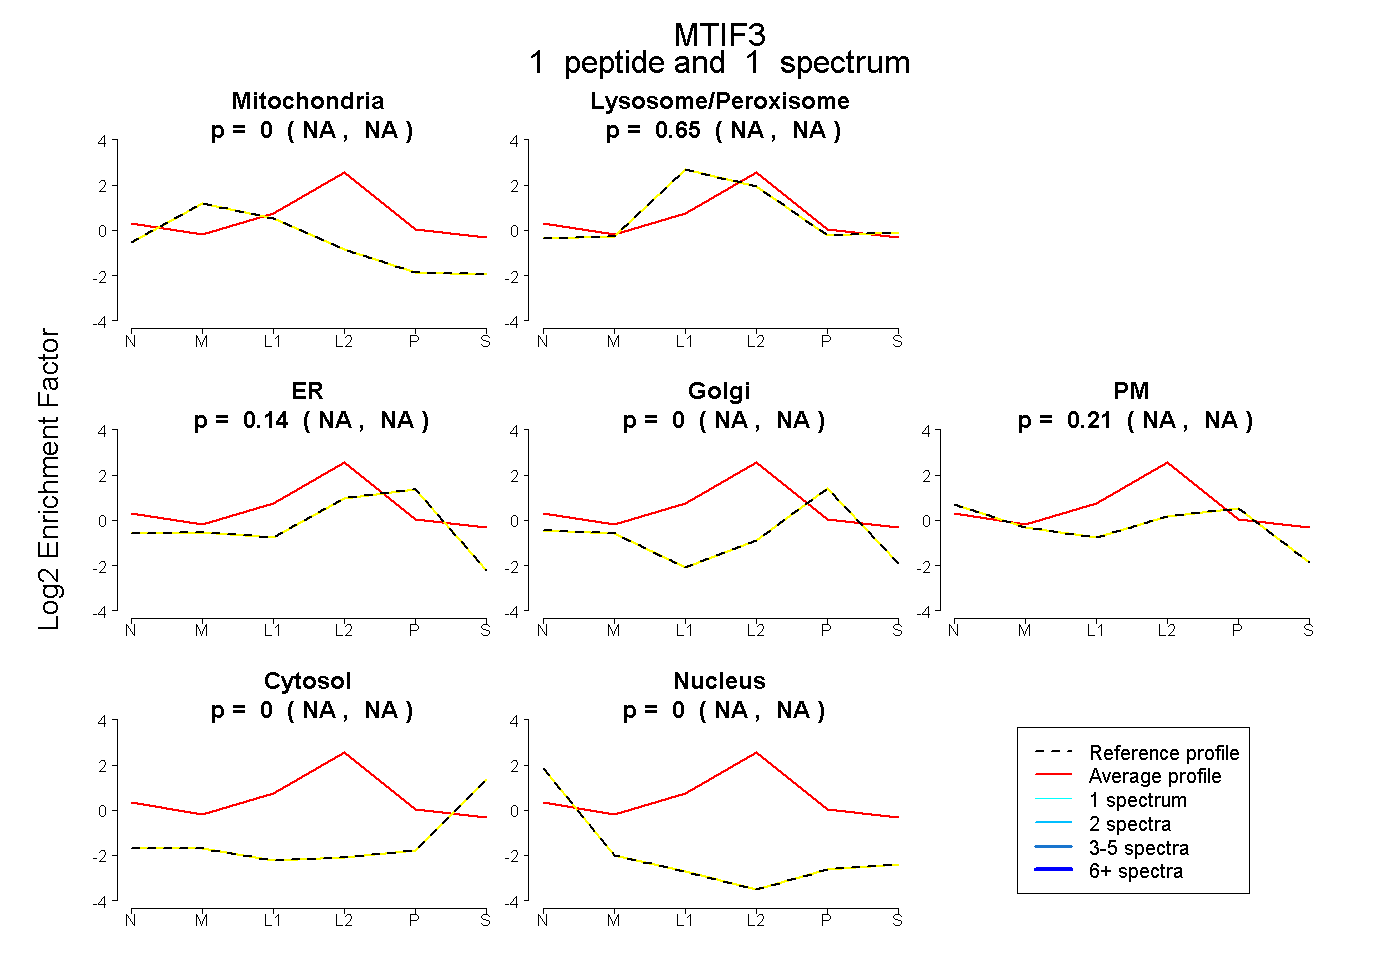
NA | NA
NA | NA
NA | NA
NA | NA
NA | NA
NA | NA
NA | NA
6peptides
spectra
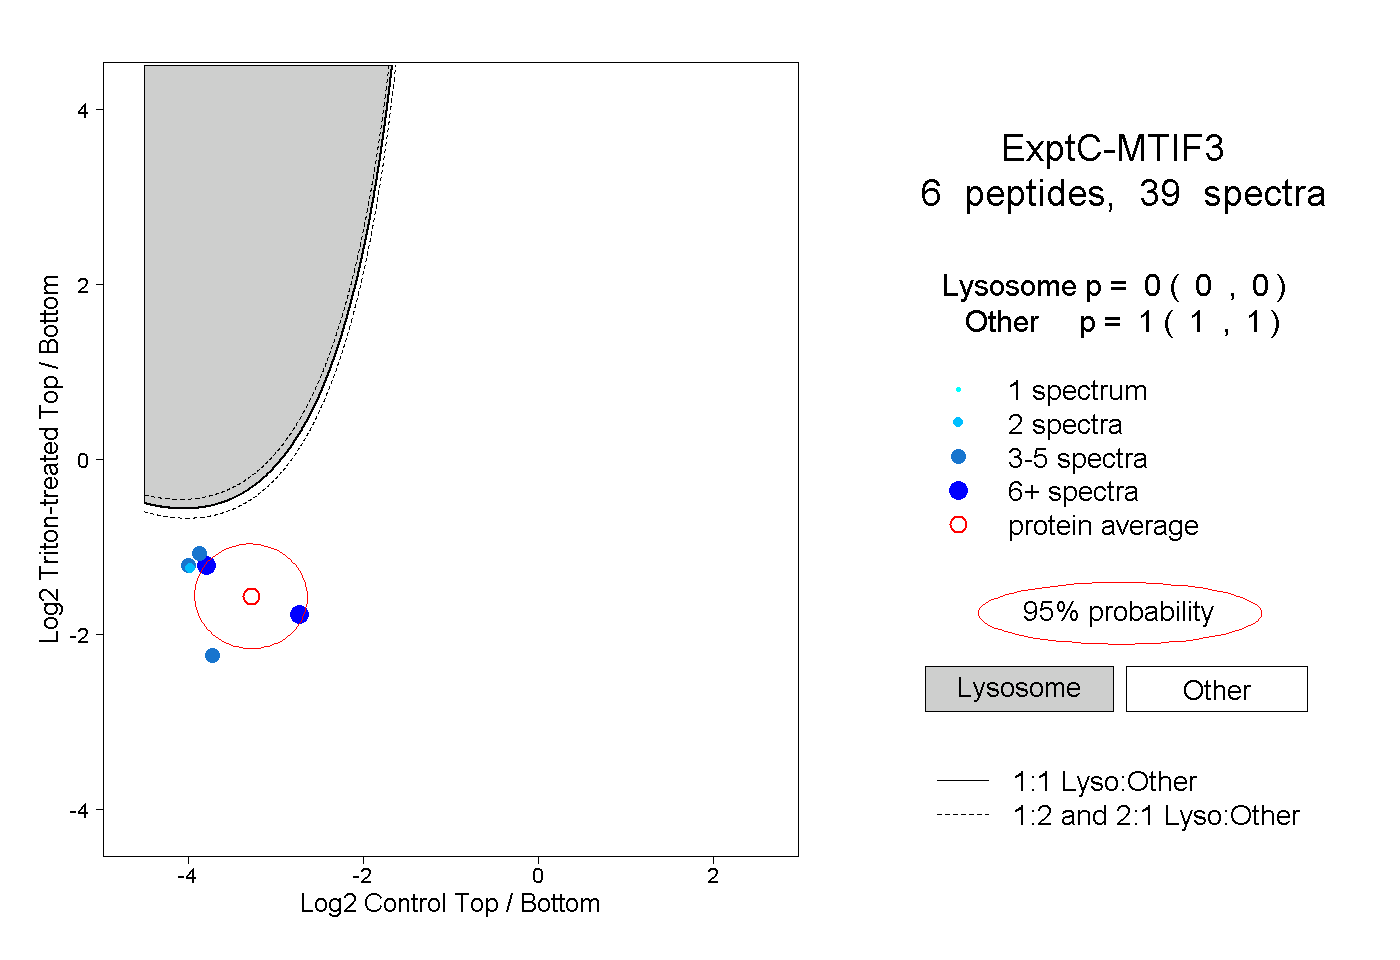
0.000 | 0.000
1.000 | 1.000