 2
2peptides
spectra
0.000 | 0.000
0.000 | 0.262
0.000 | 0.361
0.000 | 0.360
0.000 | 0.326
0.000 | 0.352
0.281 | 0.412
0.000 | 0.002
3peptides
spectra
0.003 | 0.014
0.986 | 0.997
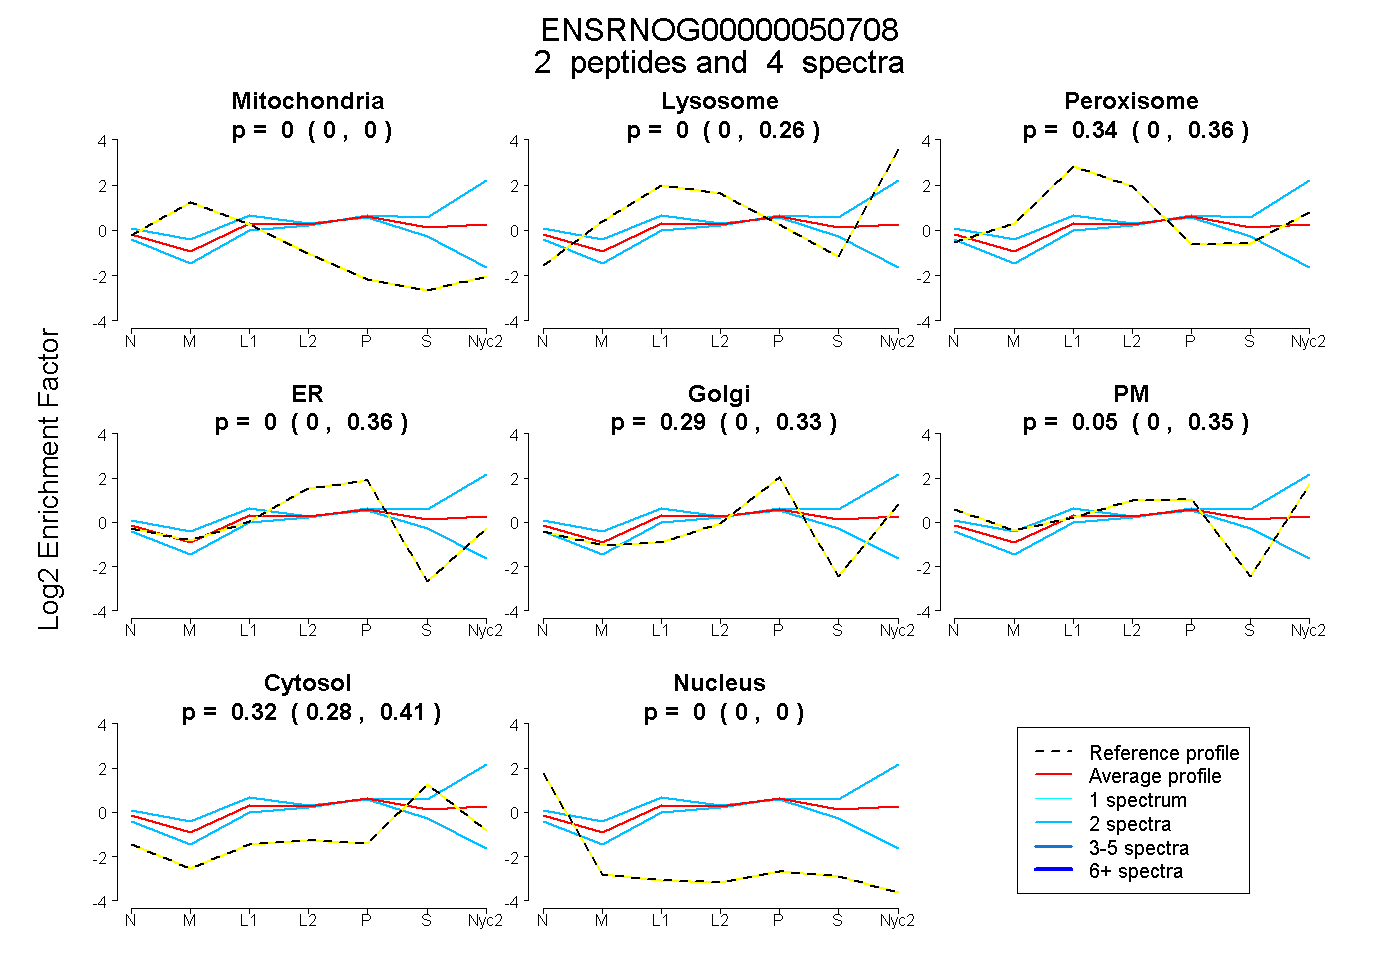
| Plot | Mito | Lyso | Perox | ER | Golgi | PM | Cytosol | Nucleus | |||||
| Expt A |
2 peptides |
4 spectra |
|
0.000 0.000 | 0.000 |
0.000 0.000 | 0.262 |
0.344 0.000 | 0.361 |
0.000 0.000 | 0.360 |
0.288 0.000 | 0.326 |
0.047 0.000 | 0.352 |
0.321 0.281 | 0.412 |
0.000 0.000 | 0.002 |
||
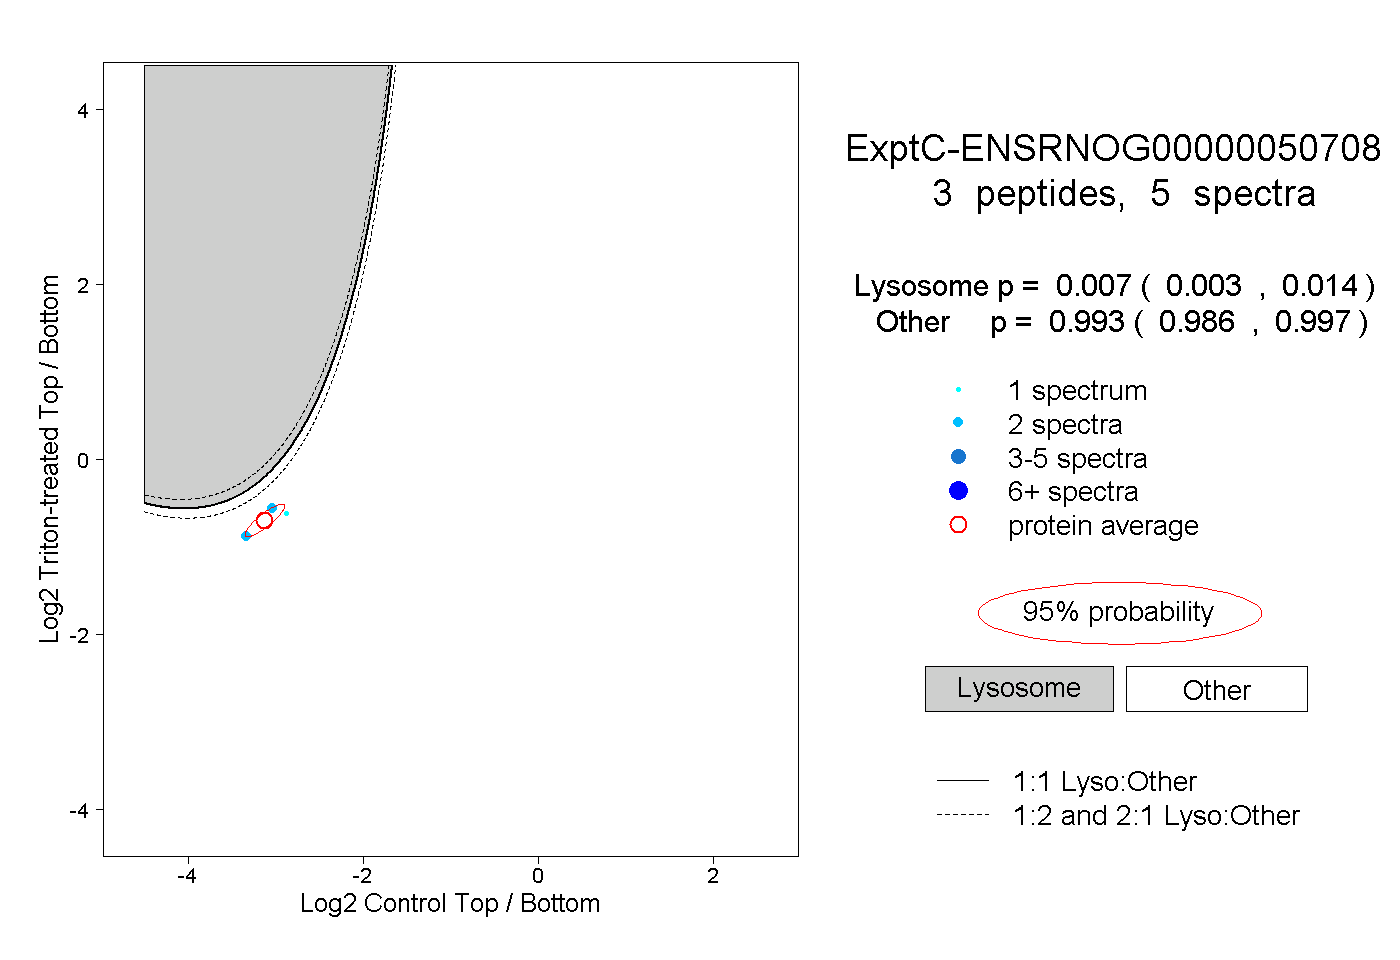
| Plot | Lyso | Other | |||||||||||
| Expt C |
3 peptides |
5 spectra |
|
0.007 0.003 | 0.014 |
0.993 0.986 | 0.997 |