 3
3peptides
spectra
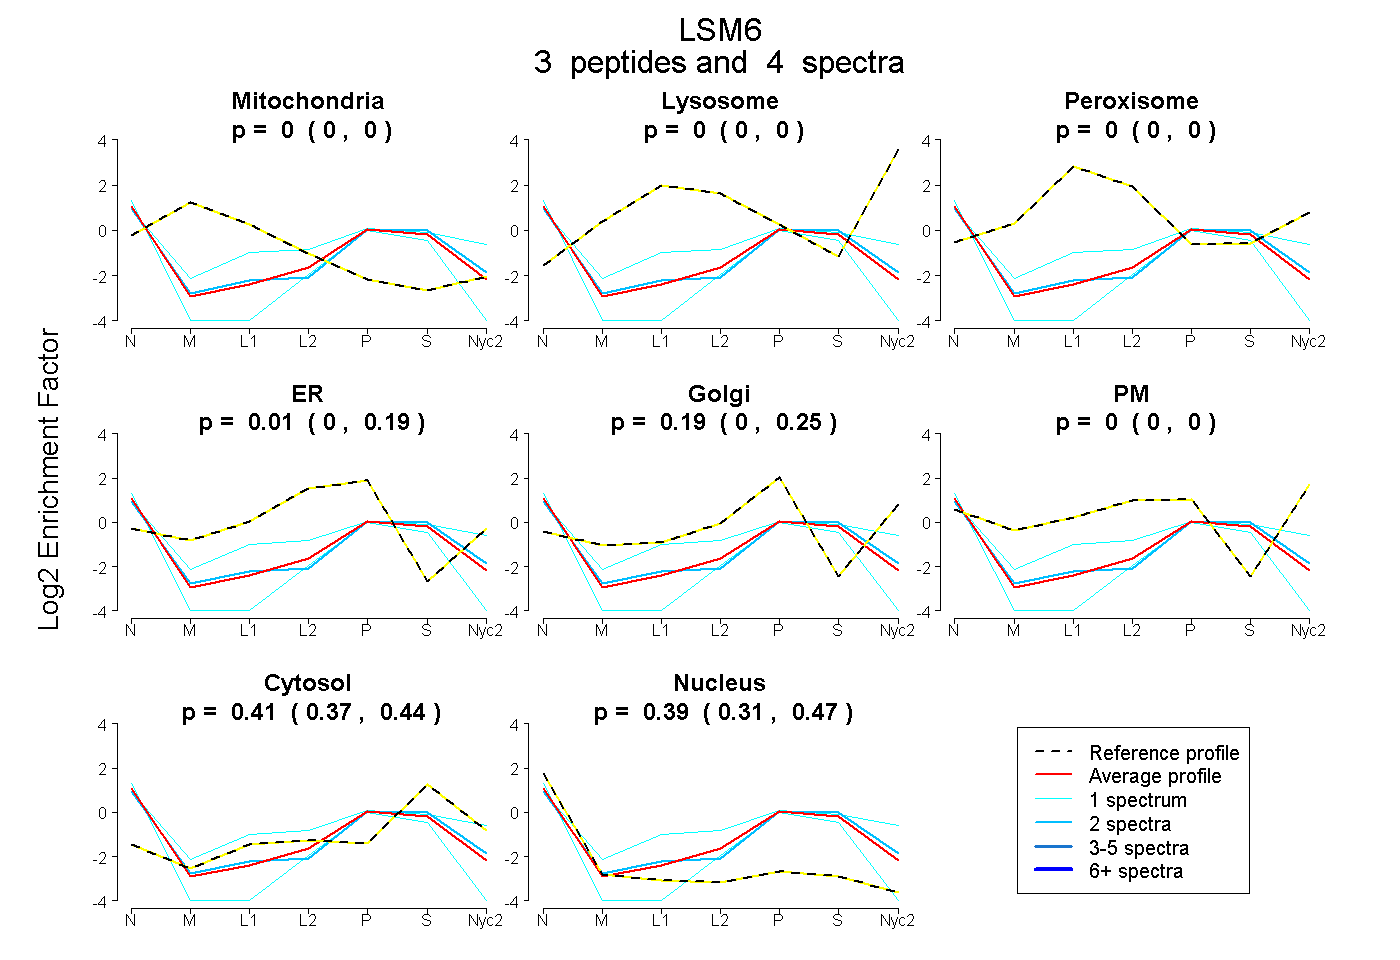
0.000 | 0.000
0.000 | 0.000
0.000 | 0.000
0.000 | 0.191
0.000 | 0.254
0.000 | 0.000
0.369 | 0.439
0.309 | 0.465
| Plot | Mito | Lyso | Perox | ER | Golgi | PM | Cytosol | Nucleus | |||||
| Expt A |
3 peptides |
4 spectra |
|
0.000 0.000 | 0.000 |
0.000 0.000 | 0.000 |
0.000 0.000 | 0.000 |
0.011 0.000 | 0.191 |
0.189 0.000 | 0.254 |
0.000 0.000 | 0.000 |
0.405 0.369 | 0.439 |
0.394 0.309 | 0.465 |
| 2 spectra, YGDAFIR | 0.000 | 0.000 | 0.000 | 0.000 | 0.191 | 0.000 | 0.447 | 0.362 | ||
| 1 spectrum, QTPSDFLK | 0.000 | 0.000 | 0.000 | 0.017 | 0.009 | 0.347 | 0.455 | 0.172 | ||
| 1 spectrum, QIIGRPVVVK | 0.000 | 0.000 | 0.000 | 0.011 | 0.000 | 0.000 | 0.321 | 0.668 |
| Plot | Mito | Lyso or Perox | ER | Golgi | PM | Cytosol | Nucleus | ||||||
| Expt B |
1 peptide |
2 spectra |
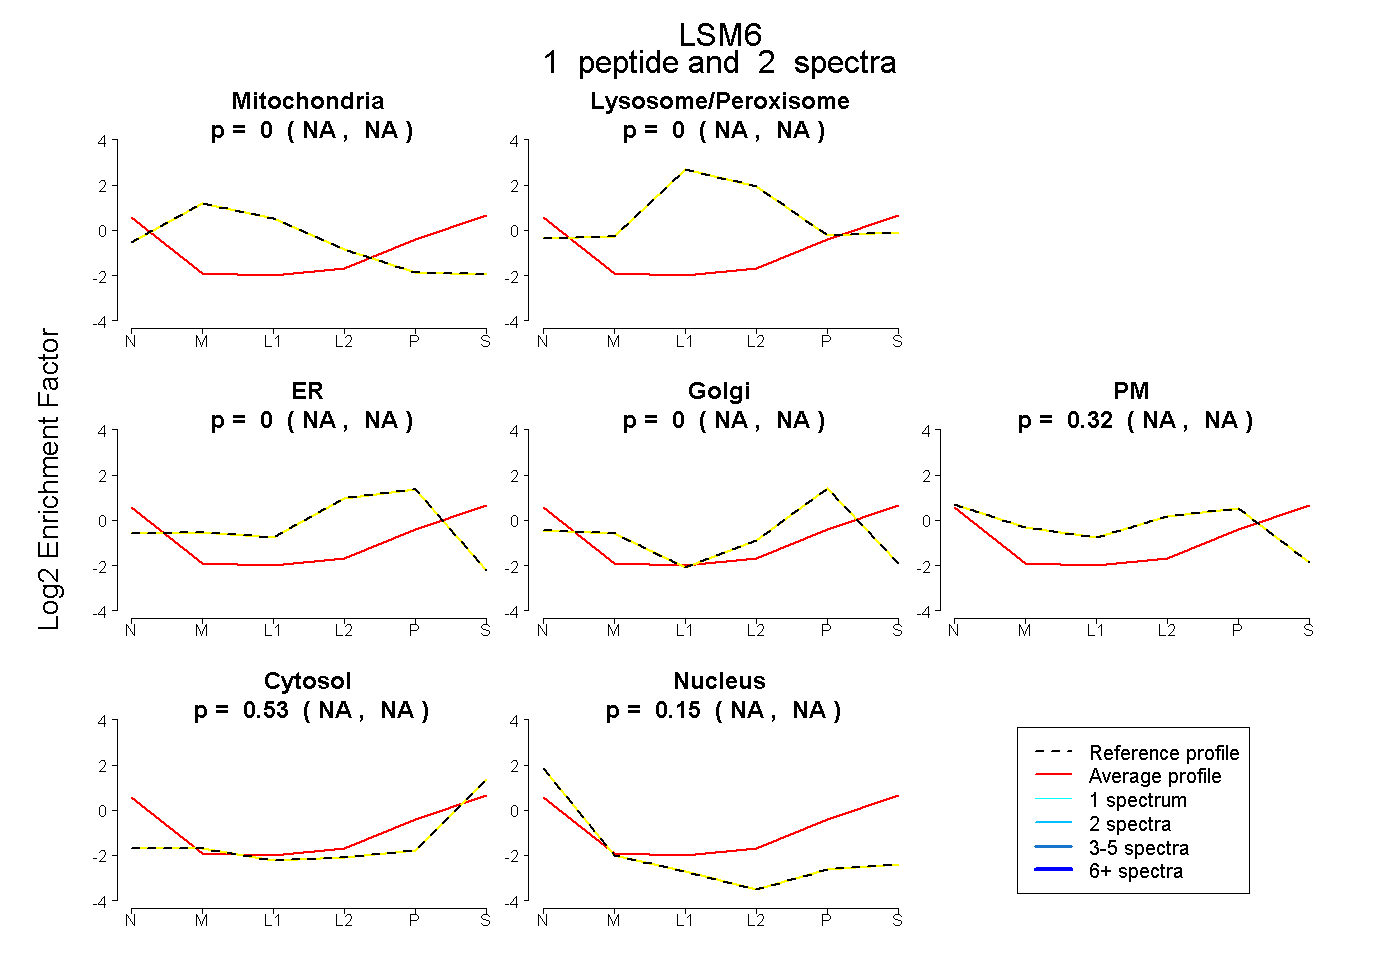 |
0.000 NA | NA |
0.000 NA | NA |
0.000 NA | NA |
0.000 NA | NA |
0.317 NA | NA |
0.531 NA | NA |
0.152 NA | NA |
|||
| Plot | Lyso | Other | |||||||||||
| Expt C |
2 peptides |
4 spectra |
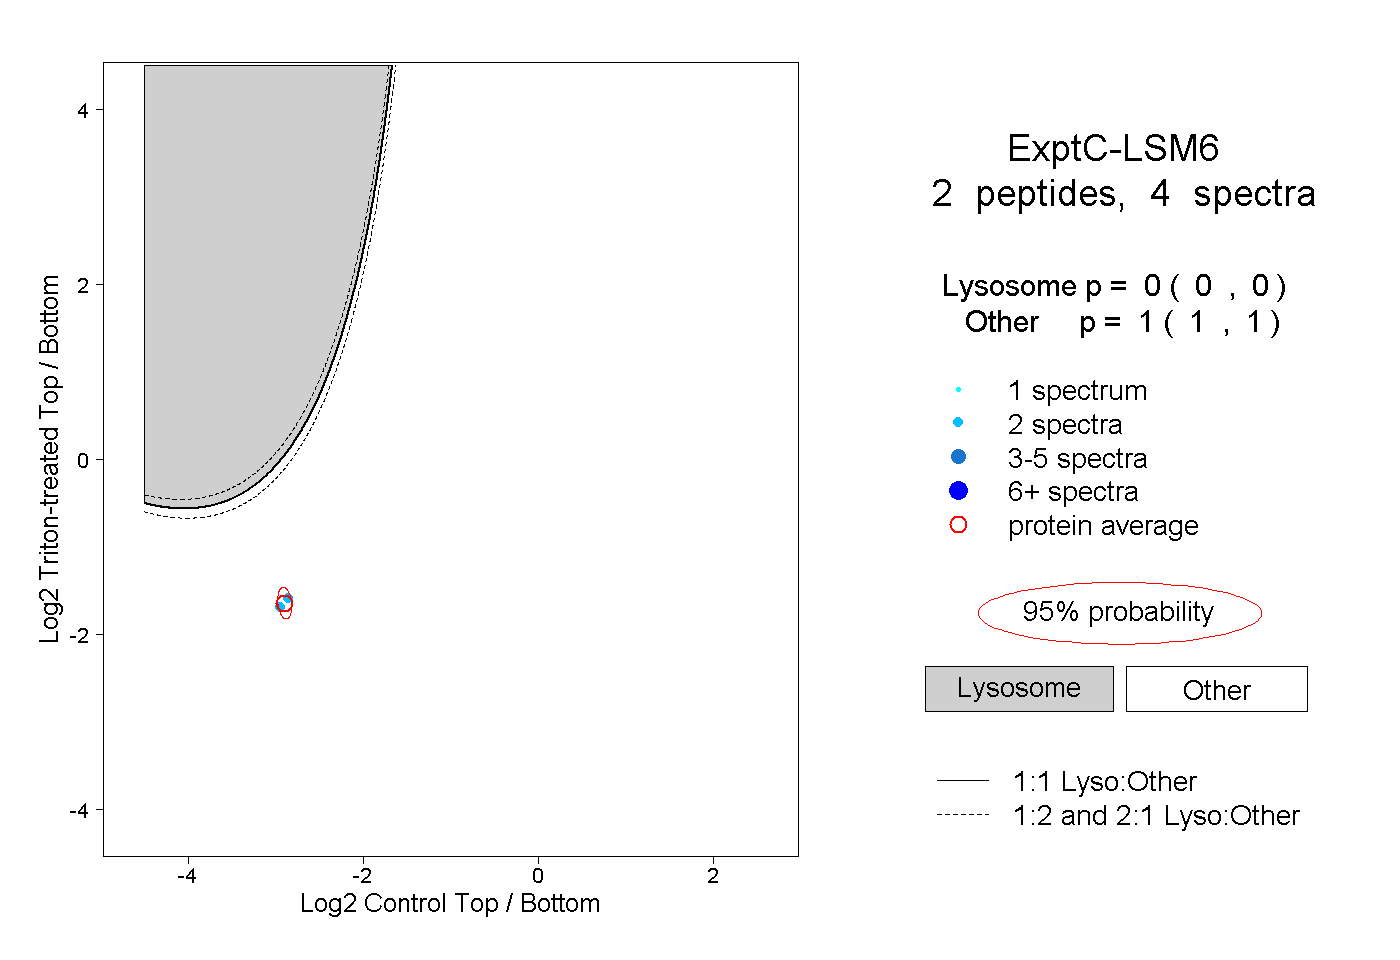 |
0.000 0.000 | 0.000 |
1.000 1.000 | 1.000 |