9
9peptides
spectra
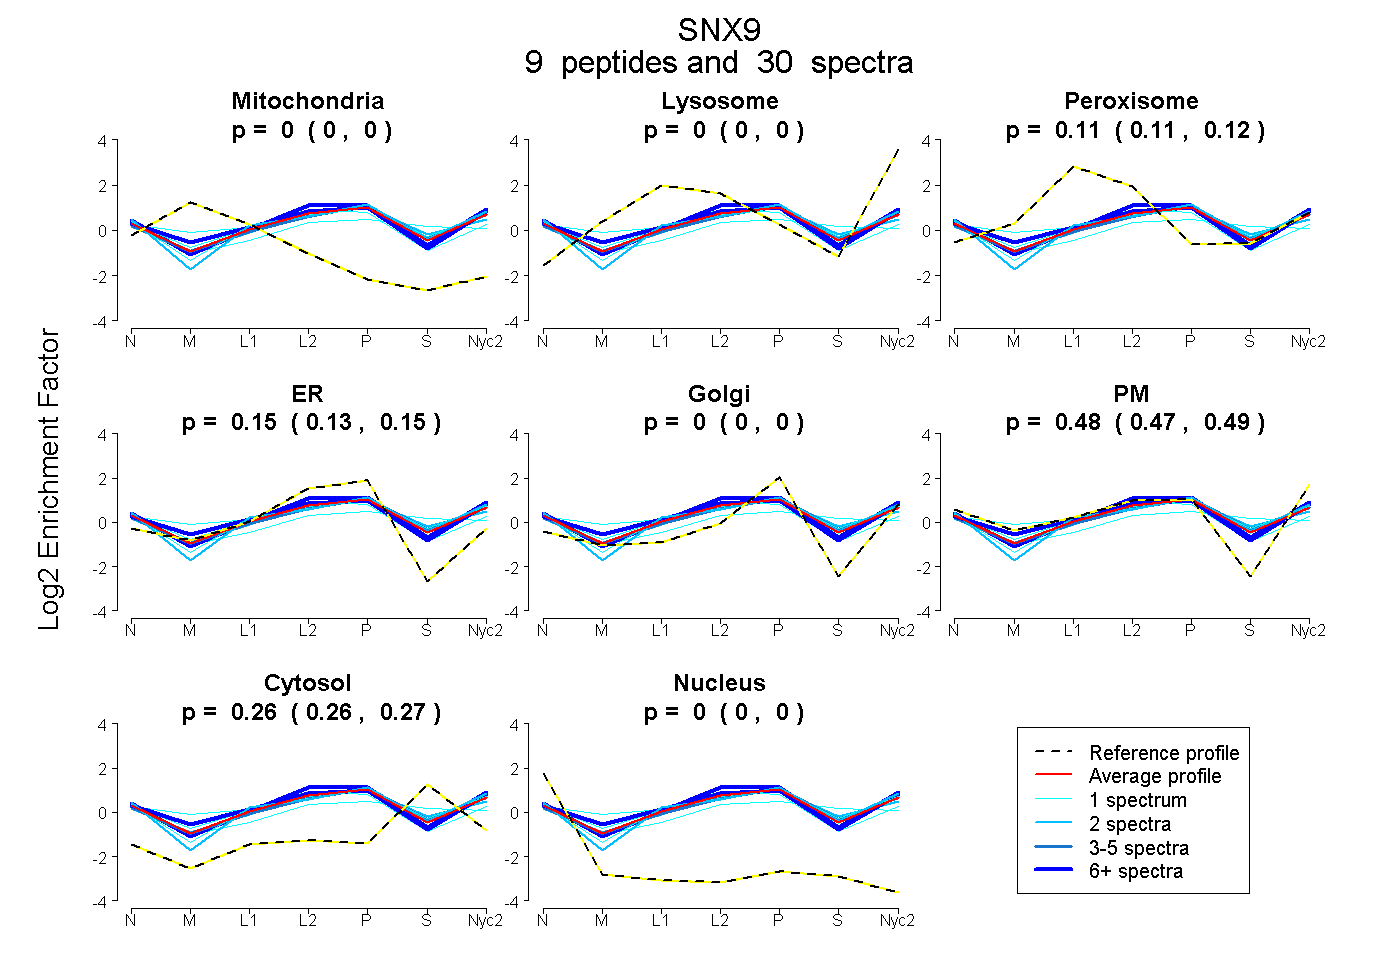
0.000 | 0.000
0.000 | 0.000
0.107 | 0.119
0.134 | 0.155
0.000 | 0.004
0.466 | 0.487
0.258 | 0.267
0.000 | 0.000
3peptides
spectra
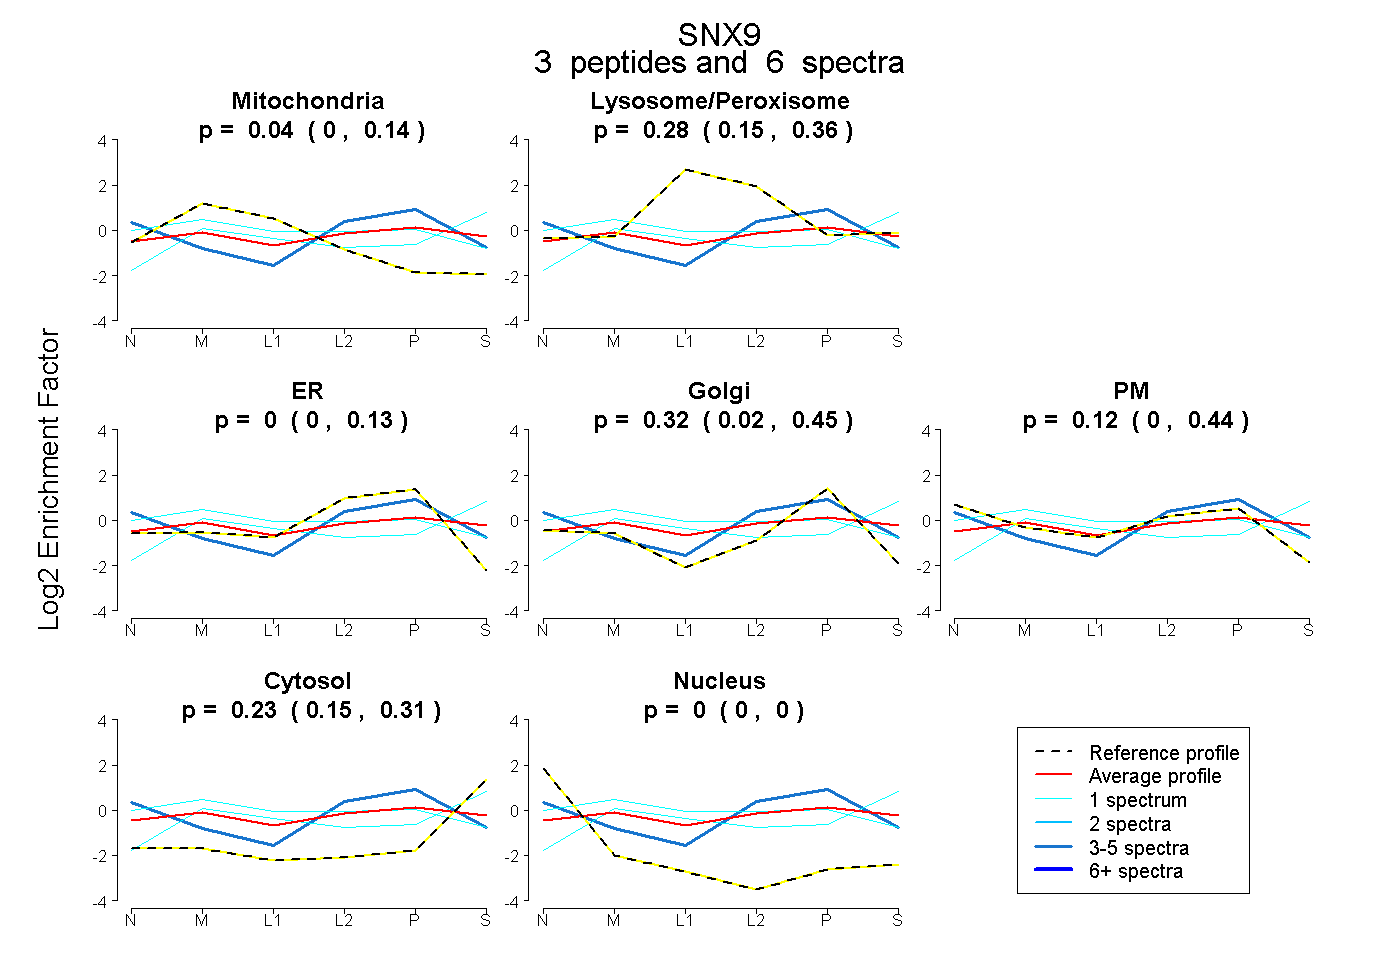
0.000 | 0.136
0.148 | 0.355
0.000 | 0.128
0.017 | 0.447
0.000 | 0.444
0.153 | 0.310
0.000 | 0.000