 9
9peptides
spectra
0.000 | 0.000
0.000 | 0.000
0.107 | 0.119
0.134 | 0.155
0.000 | 0.004
0.466 | 0.487
0.258 | 0.267
0.000 | 0.000
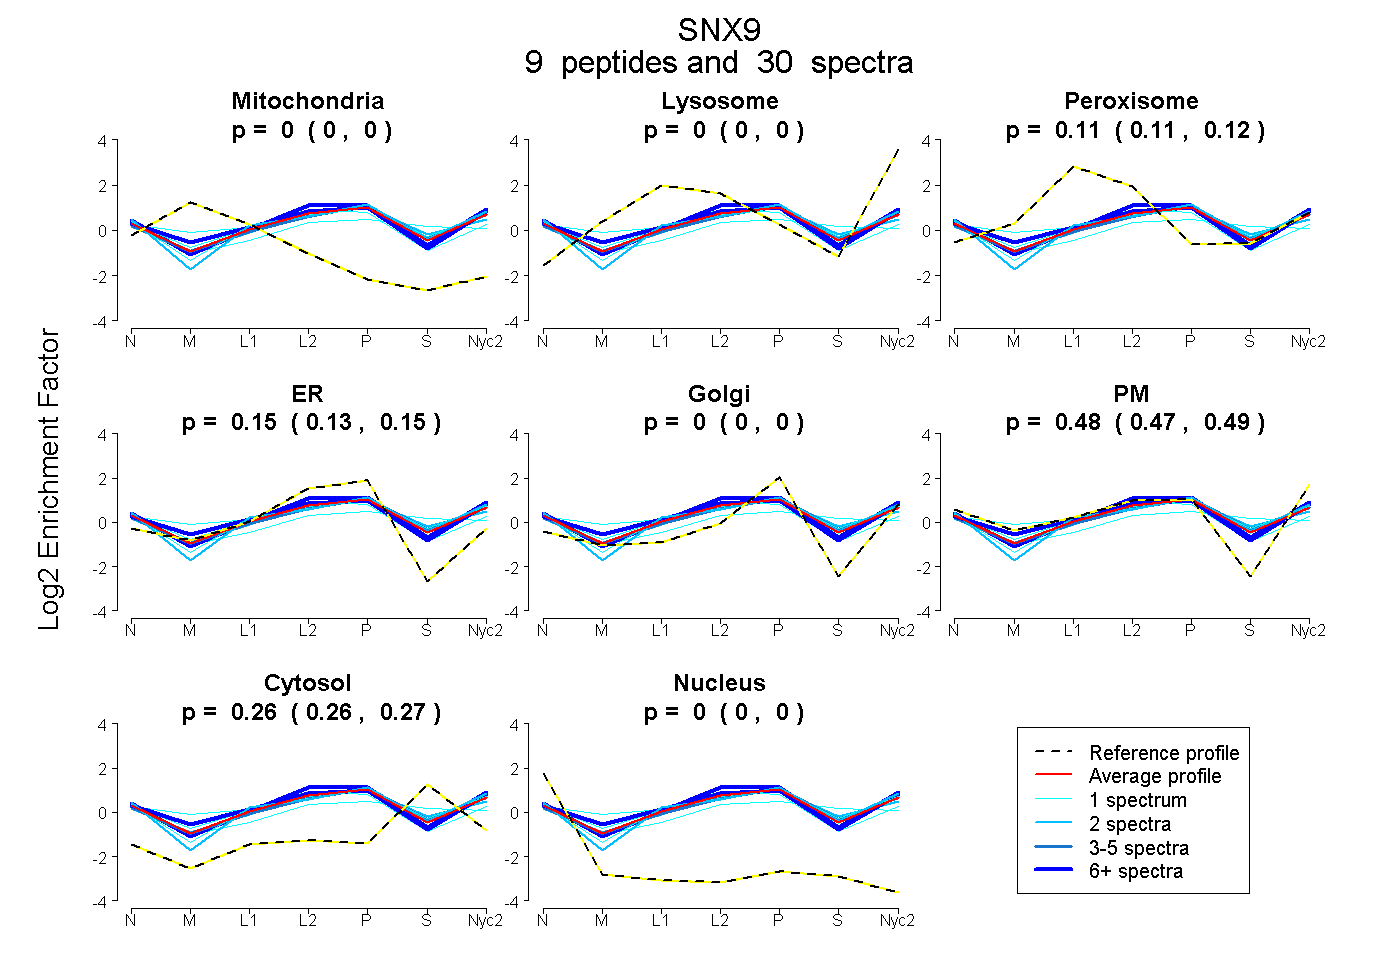
| Plot | Mito | Lyso | Perox | ER | Golgi | PM | Cytosol | Nucleus | |||||
| Expt A |
9 peptides |
30 spectra |
|
0.000 0.000 | 0.000 |
0.000 0.000 | 0.000 |
0.113 0.107 | 0.119 |
0.146 0.134 | 0.155 |
0.000 0.000 | 0.004 |
0.478 0.466 | 0.487 |
0.263 0.258 | 0.267 |
0.000 0.000 | 0.000 |
| 1 spectrum, IYDYNSVIR | 0.000 | 0.000 | 0.167 | 0.023 | 0.115 | 0.475 | 0.221 | 0.000 | ||
| 6 spectra, LQAWMTR | 0.000 | 0.000 | 0.152 | 0.106 | 0.049 | 0.506 | 0.187 | 0.000 | ||
| 2 spectra, ELLTVGQEHWK | 0.000 | 0.000 | 0.125 | 0.200 | 0.000 | 0.376 | 0.299 | 0.000 | ||
| 2 spectra, TDGAGAQR | 0.000 | 0.000 | 0.062 | 0.108 | 0.000 | 0.532 | 0.298 | 0.000 | ||
| 12 spectra, FEEEFIK | 0.000 | 0.000 | 0.097 | 0.148 | 0.000 | 0.543 | 0.212 | 0.000 | ||
| 1 spectrum, CTGPLPK | 0.026 | 0.000 | 0.195 | 0.249 | 0.000 | 0.359 | 0.171 | 0.000 | ||
| 1 spectrum, SYIEYQLTPTNTNR | 0.000 | 0.000 | 0.119 | 0.115 | 0.000 | 0.470 | 0.296 | 0.000 | ||
| 1 spectrum, CDAVGK | 0.000 | 0.000 | 0.097 | 0.132 | 0.000 | 0.333 | 0.438 | 0.000 | ||
| 4 spectra, HFDWLYER | 0.000 | 0.000 | 0.134 | 0.087 | 0.116 | 0.397 | 0.267 | 0.000 |
| Plot | Mito | Lyso or Perox | ER | Golgi | PM | Cytosol | Nucleus | ||||||
| Expt B |
3 peptides |
6 spectra |
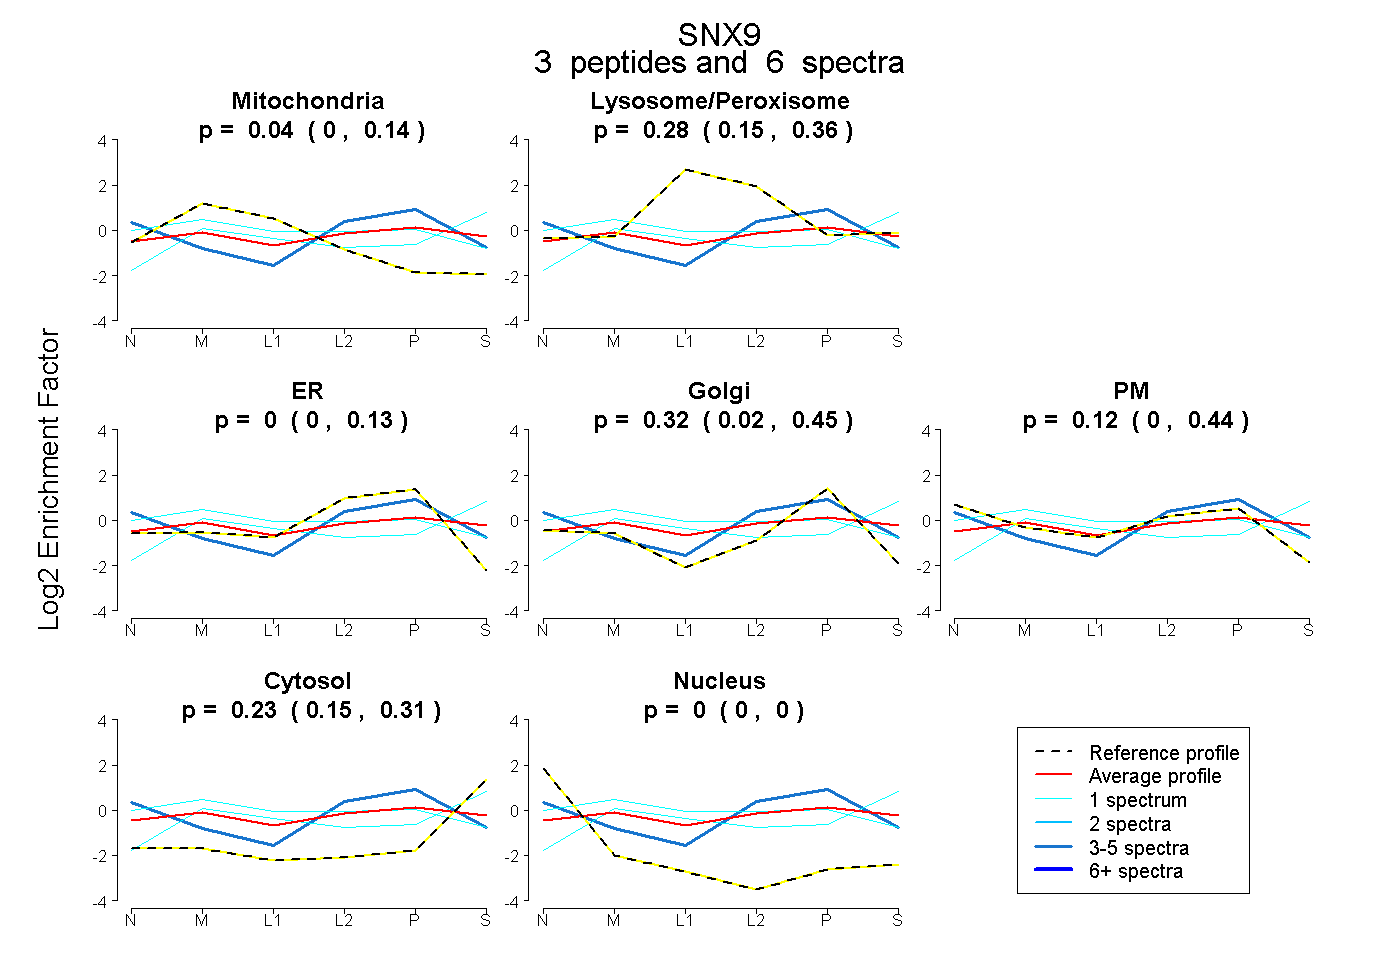 |
0.043 0.000 | 0.136 |
0.284 0.148 | 0.355 |
0.000 0.000 | 0.128 |
0.318 0.017 | 0.447 |
0.124 0.000 | 0.444 |
0.231 0.153 | 0.310 |
0.000 0.000 | 0.000 |
|||
| Plot | Lyso | Other | |||||||||||
| Expt C |
14 peptides |
35 spectra |
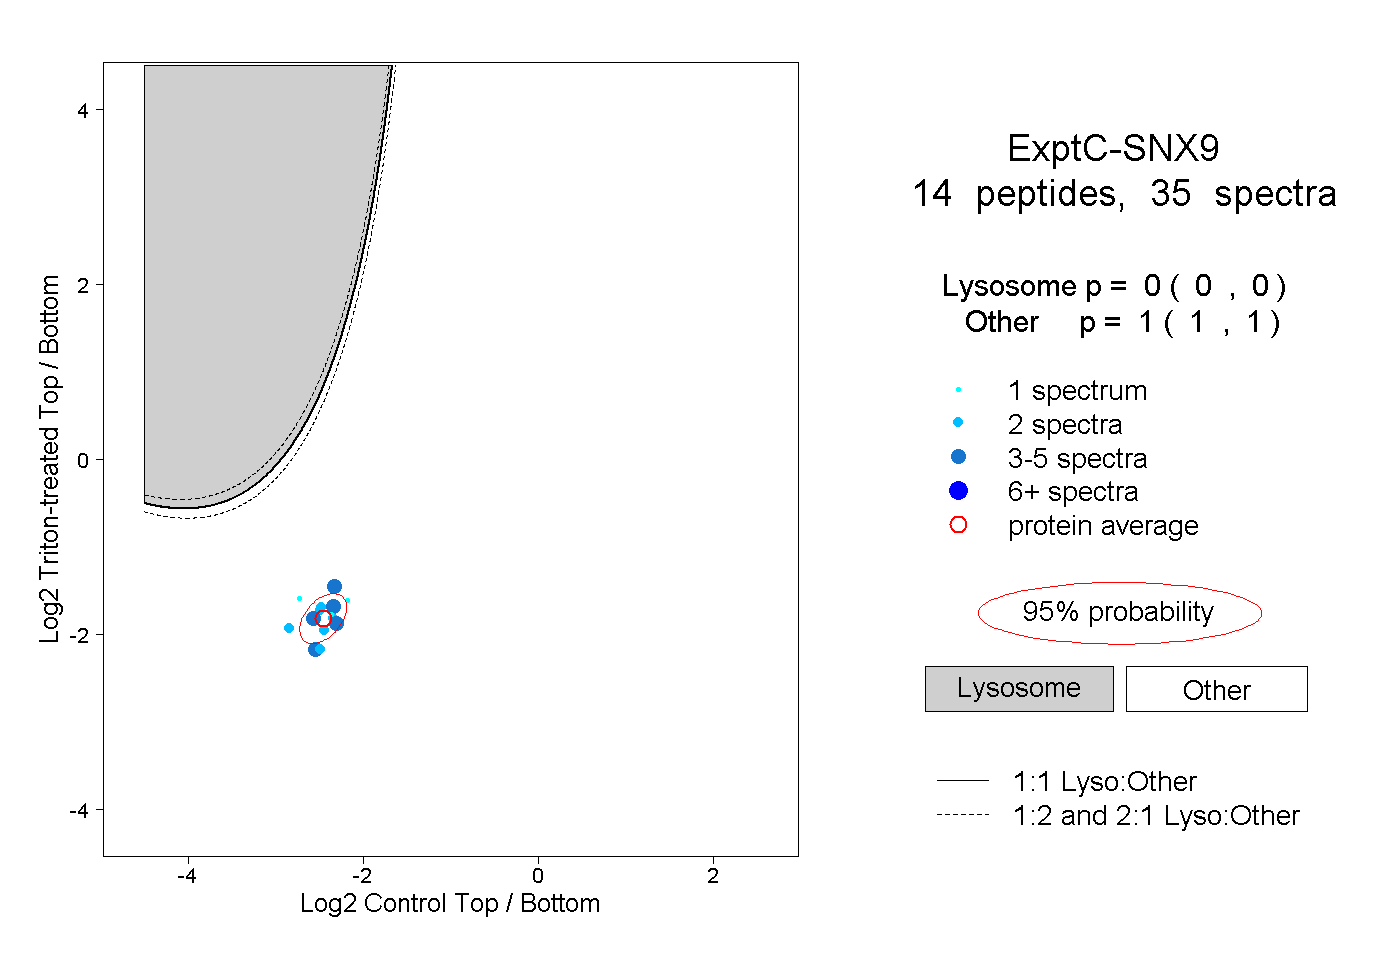 |
0.000 0.000 | 0.000 |
1.000 1.000 | 1.000 |
||||||||
| Plot | Lyso | Other | |||||||||||
| Expt D |
1 peptide |
1 spectrum |
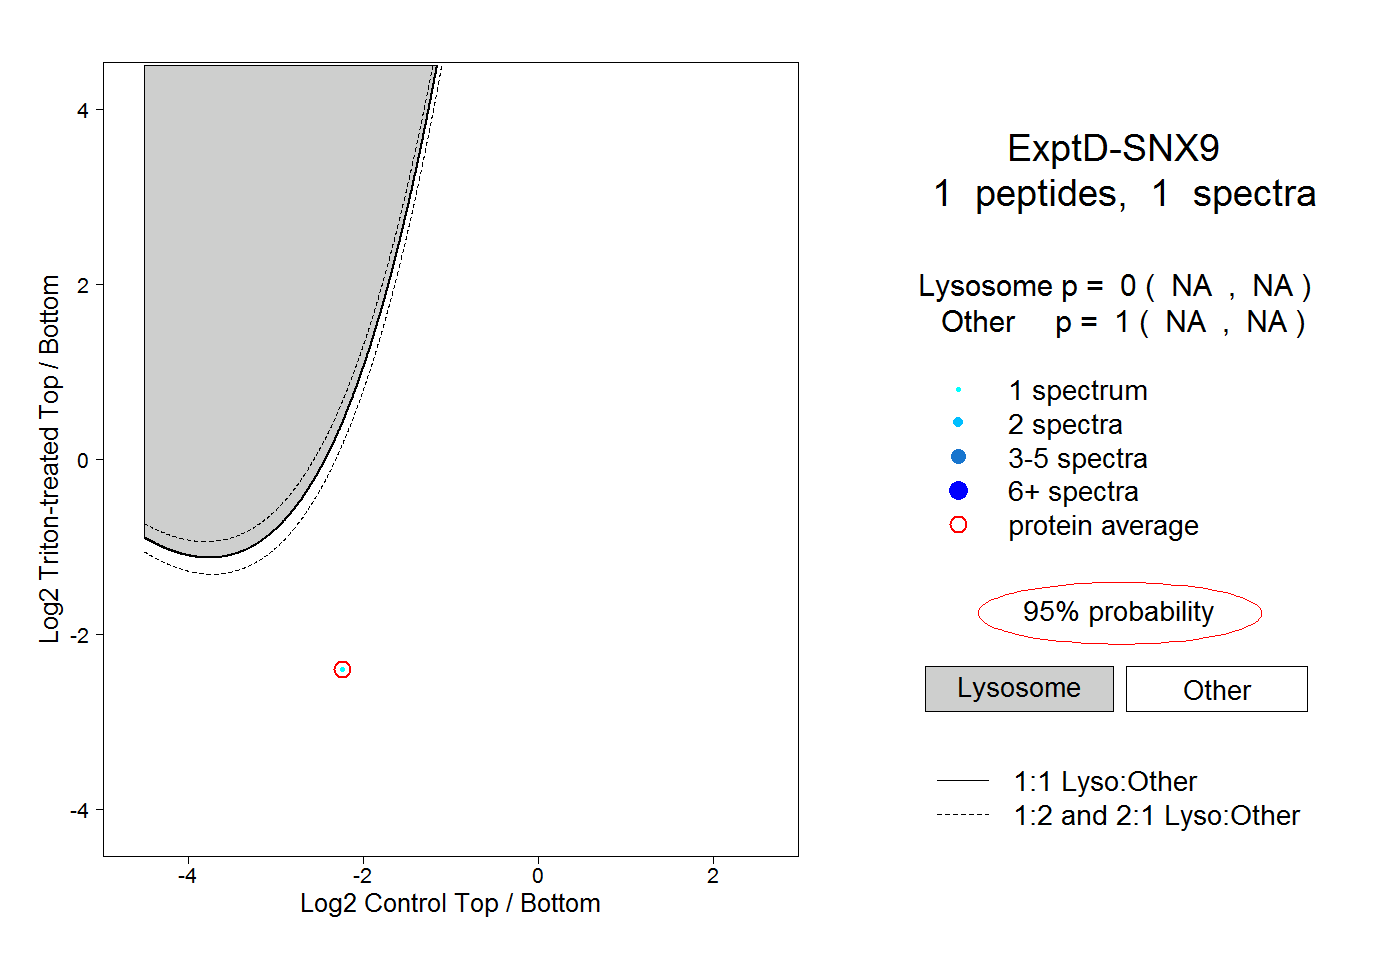 |
0.000 NA | NA |
1.000 NA | NA |