4
4peptides
spectra
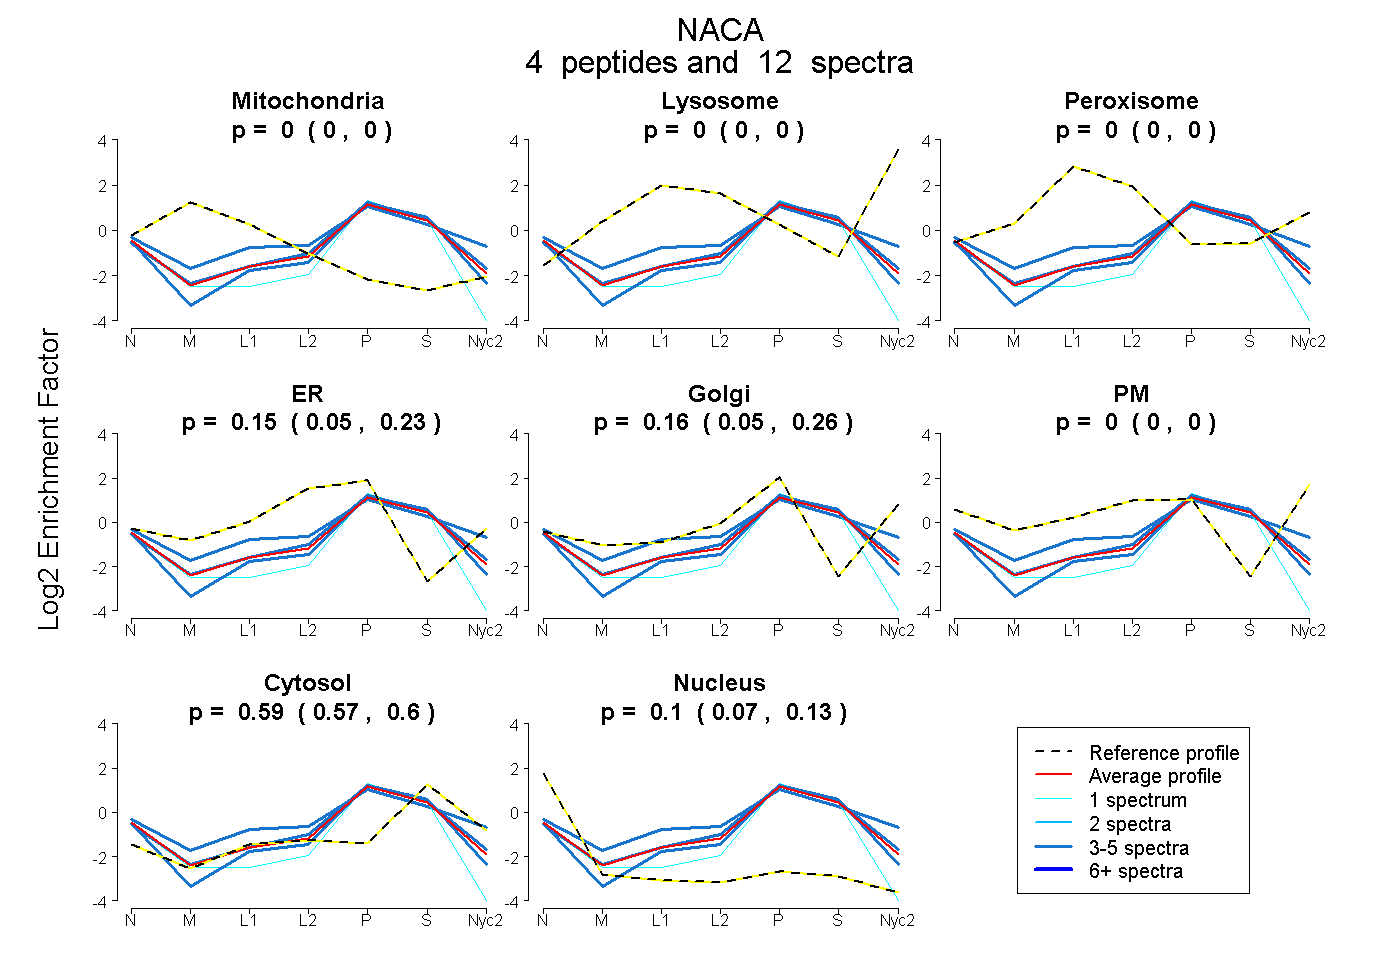
0.000 | 0.000
0.000 | 0.000
0.000 | 0.000
0.052 | 0.234
0.046 | 0.259
0.000 | 0.000
0.571 | 0.596
0.073 | 0.127
4peptides
spectra
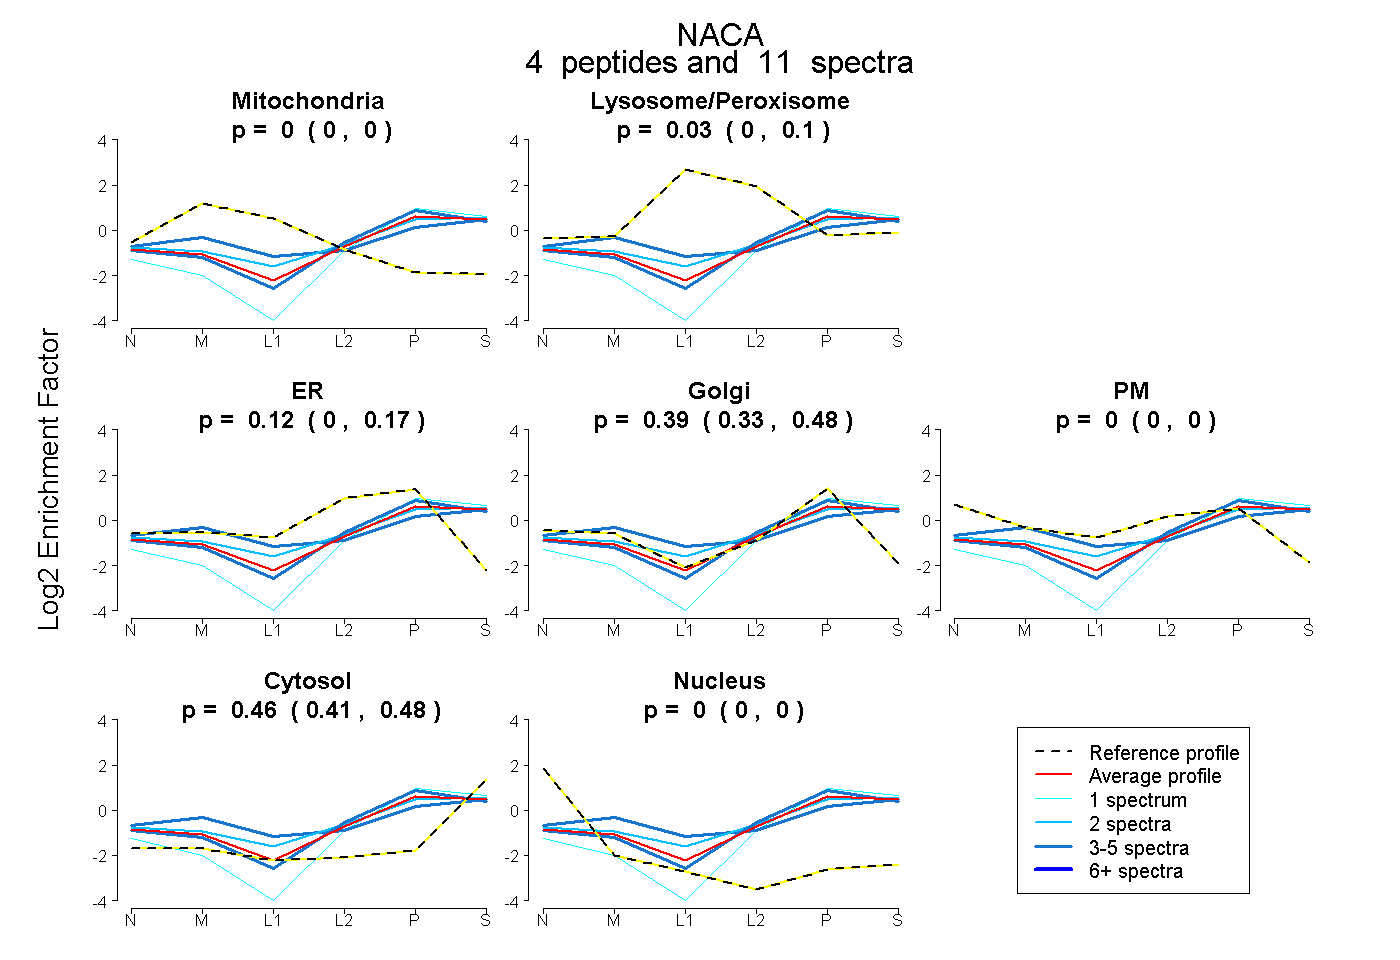
0.000 | 0.000
0.000 | 0.101
0.000 | 0.174
0.332 | 0.483
0.000 | 0.000
0.413 | 0.483
0.000 | 0.000