 2
2peptides
spectra
0.048 | 0.168
0.000 | 0.132
0.093 | 0.229
0.000 | 0.000
0.192 | 0.317
0.000 | 0.076
0.326 | 0.419
0.000 | 0.000
3peptides
spectra
0.000 | 0.000
1.000 | 1.000
| Plot | Mito | Lyso | Perox | ER | Golgi | PM | Cytosol | Nucleus | |||||
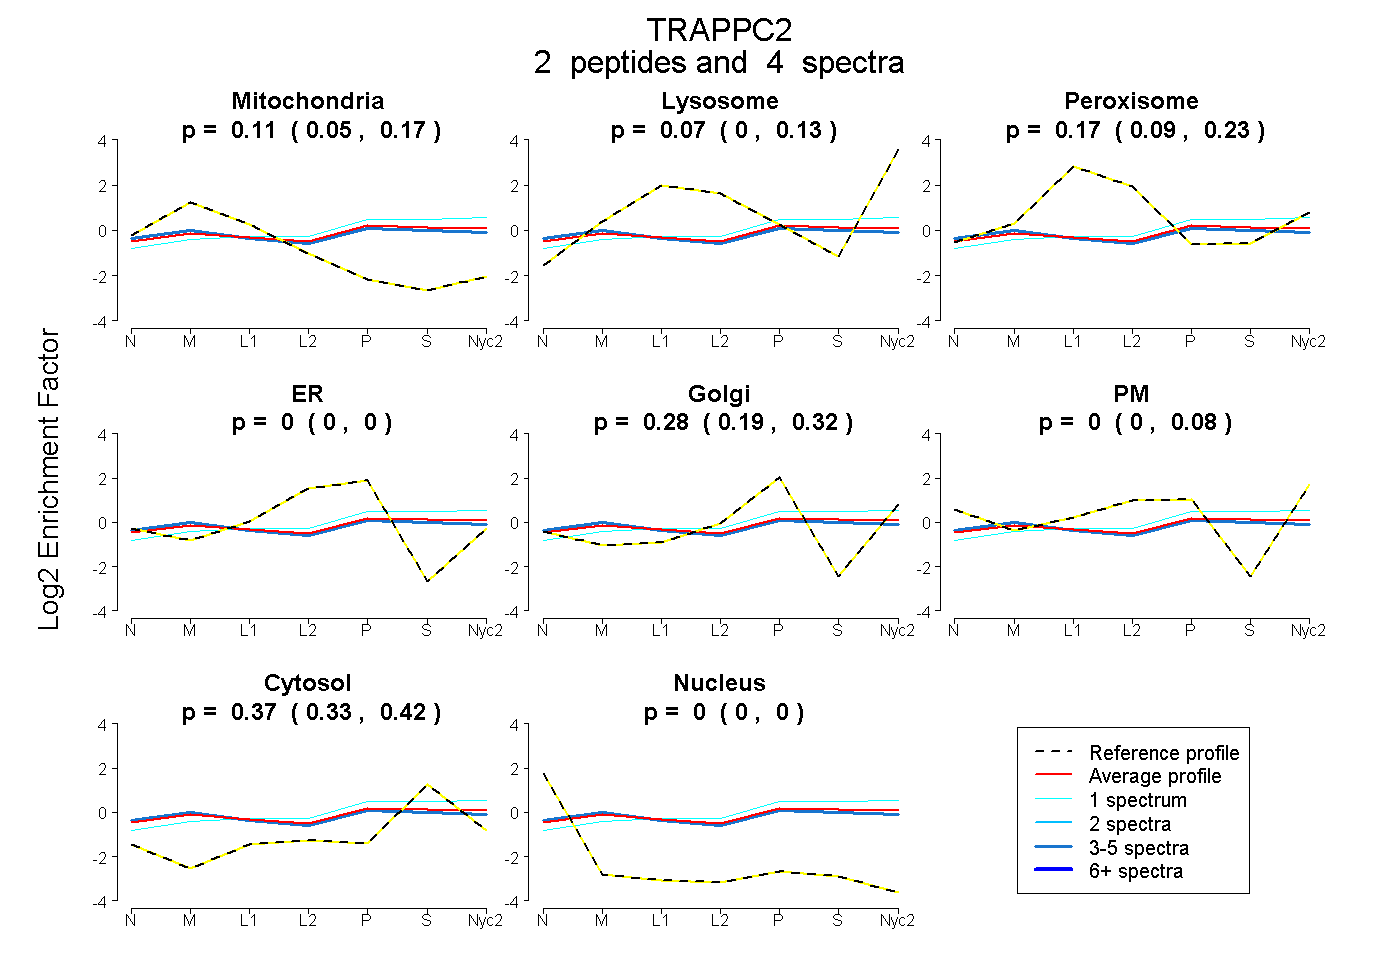
| Expt A |
2 peptides |
4 spectra |
|
0.112 0.048 | 0.168 |
0.065 0.000 | 0.132 |
0.171 0.093 | 0.229 |
0.000 0.000 | 0.000 |
0.277 0.192 | 0.317 |
0.000 0.000 | 0.076 |
0.374 0.326 | 0.419 |
0.000 0.000 | 0.000 |
||
| Plot | Lyso | Other | |||||||||||
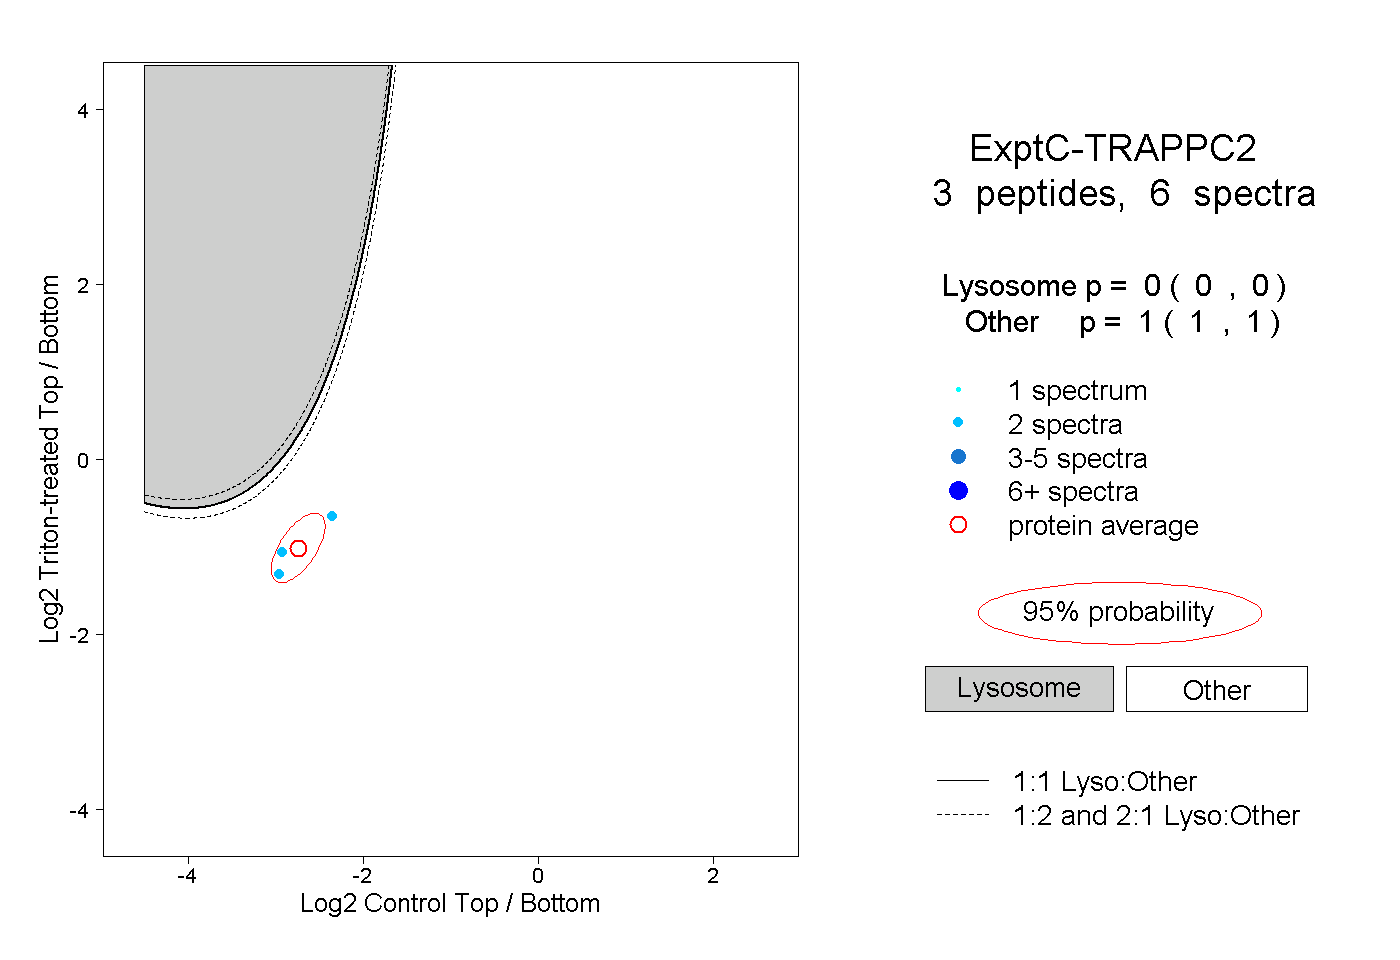
| Expt C |
3 peptides |
6 spectra |
|
0.000 0.000 | 0.000 |
1.000 1.000 | 1.000 |