 2
2peptides
spectra
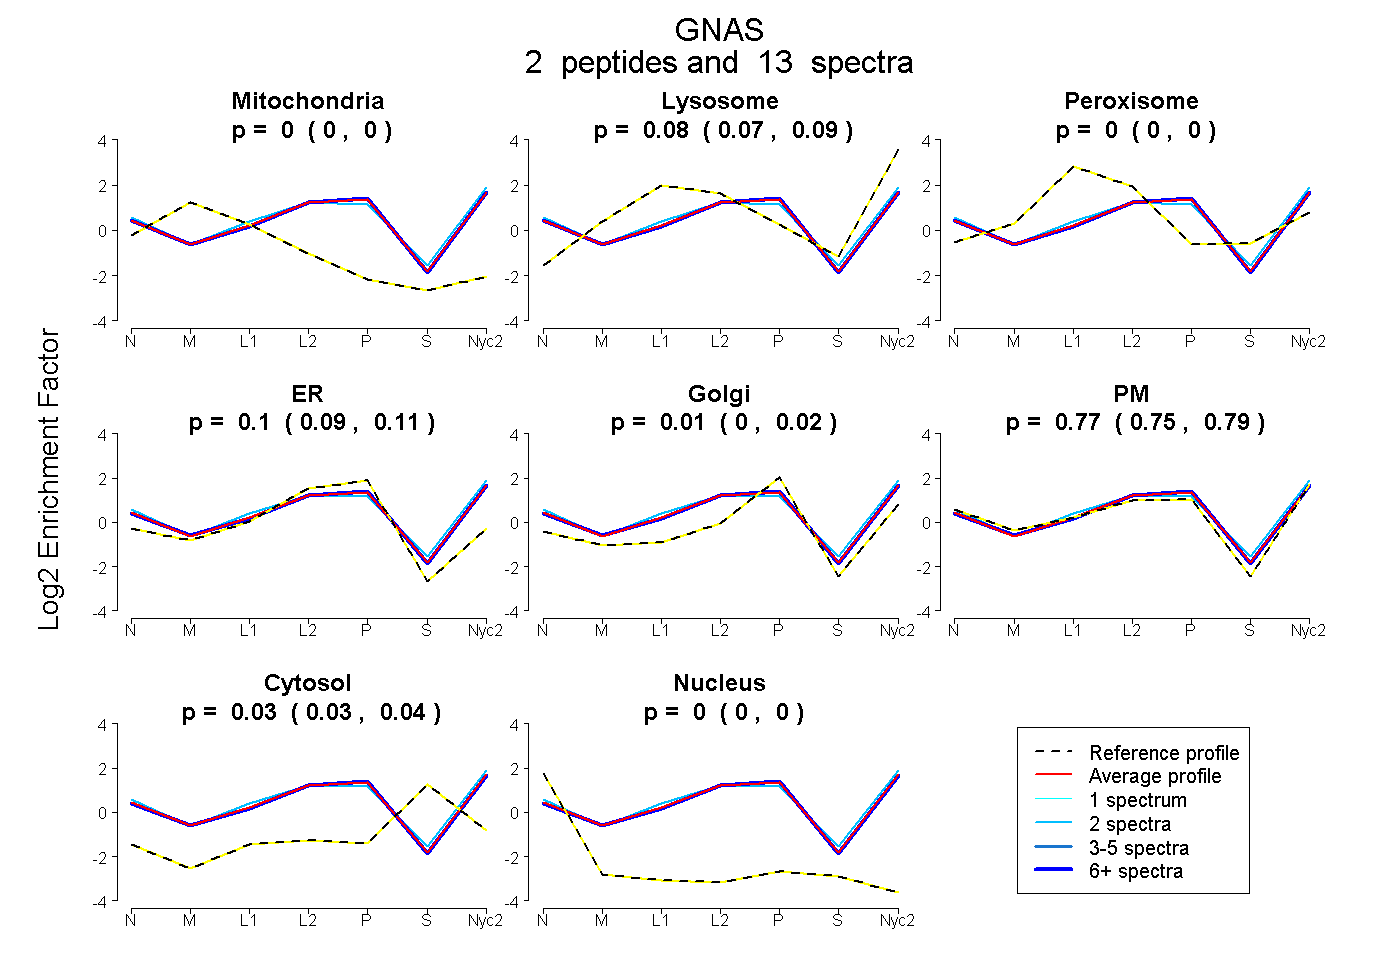
0.000 | 0.000
0.073 | 0.089
0.000 | 0.000
0.085 | 0.112
0.000 | 0.025
0.755 | 0.787
0.028 | 0.040
0.000 | 0.000
3peptides
spectra
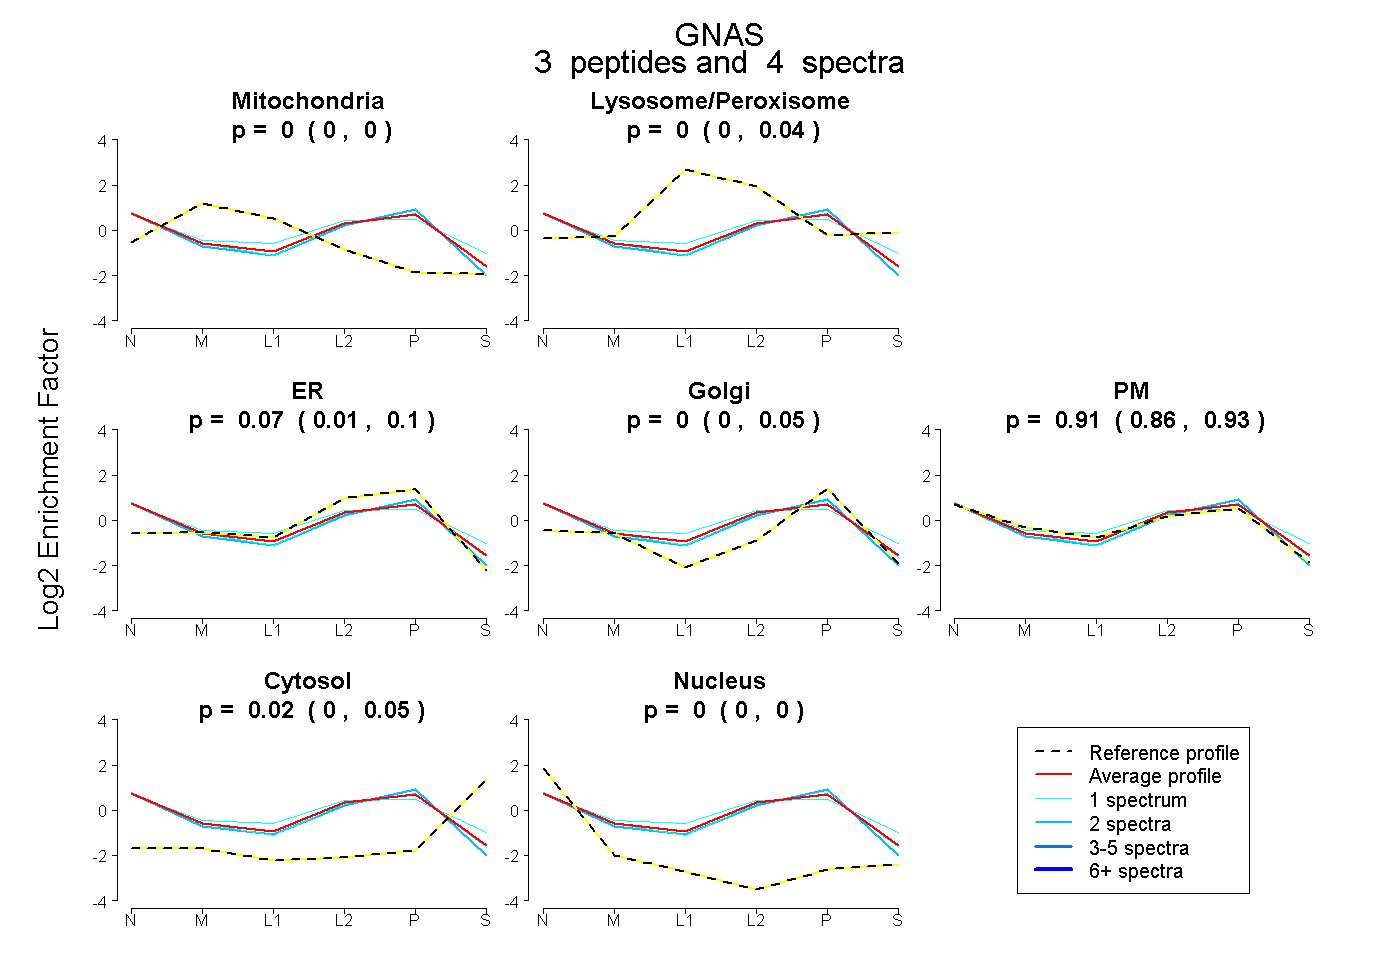
0.000 | 0.000
0.000 | 0.040
0.006 | 0.096
0.000 | 0.054
0.857 | 0.930
0.000 | 0.049
0.000 | 0.005
4peptides
spectra
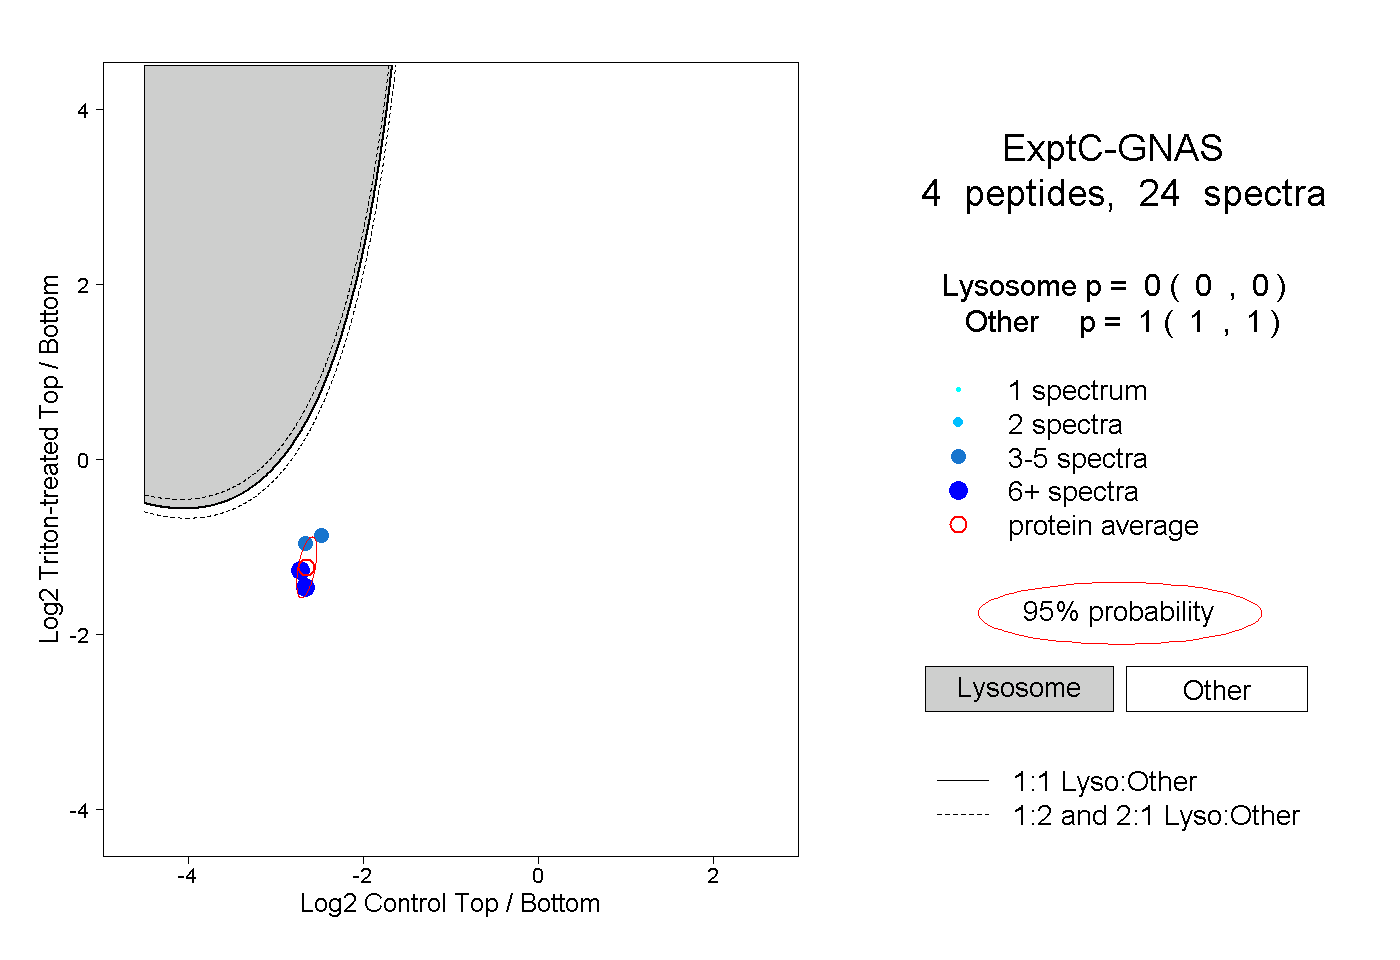
0.000 | 0.000
1.000 | 1.000
1peptide
spectra
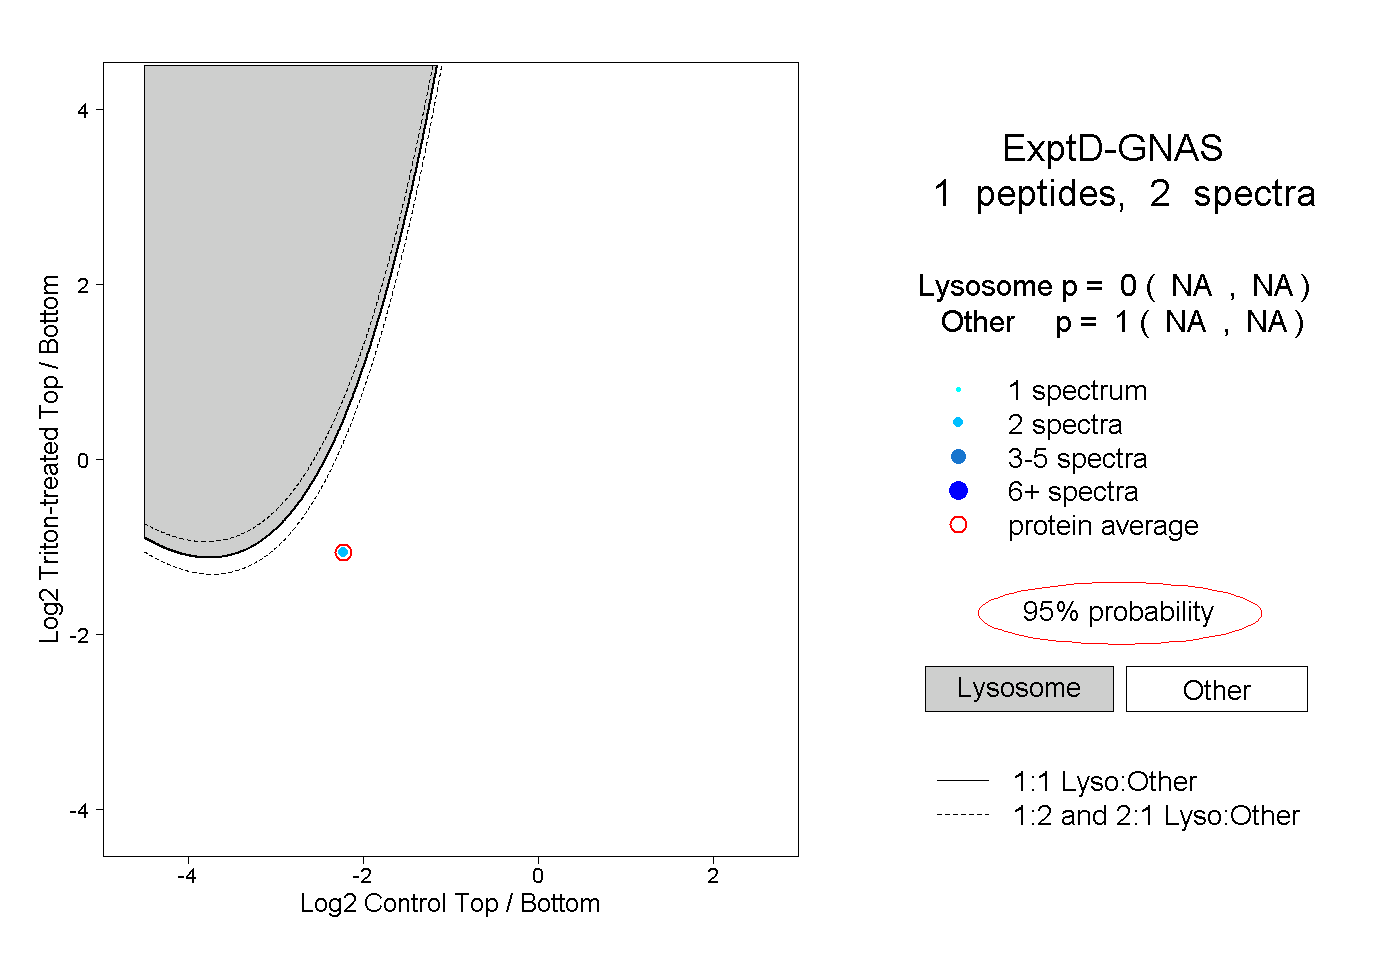
NA | NA
NA | NA