 2
2peptides
spectra
0.000 | 0.000
0.000 | 0.000
0.000 | 0.000
0.223 | 0.420
0.411 | 0.635
0.000 | 0.000
0.000 | 0.029
0.099 | 0.161
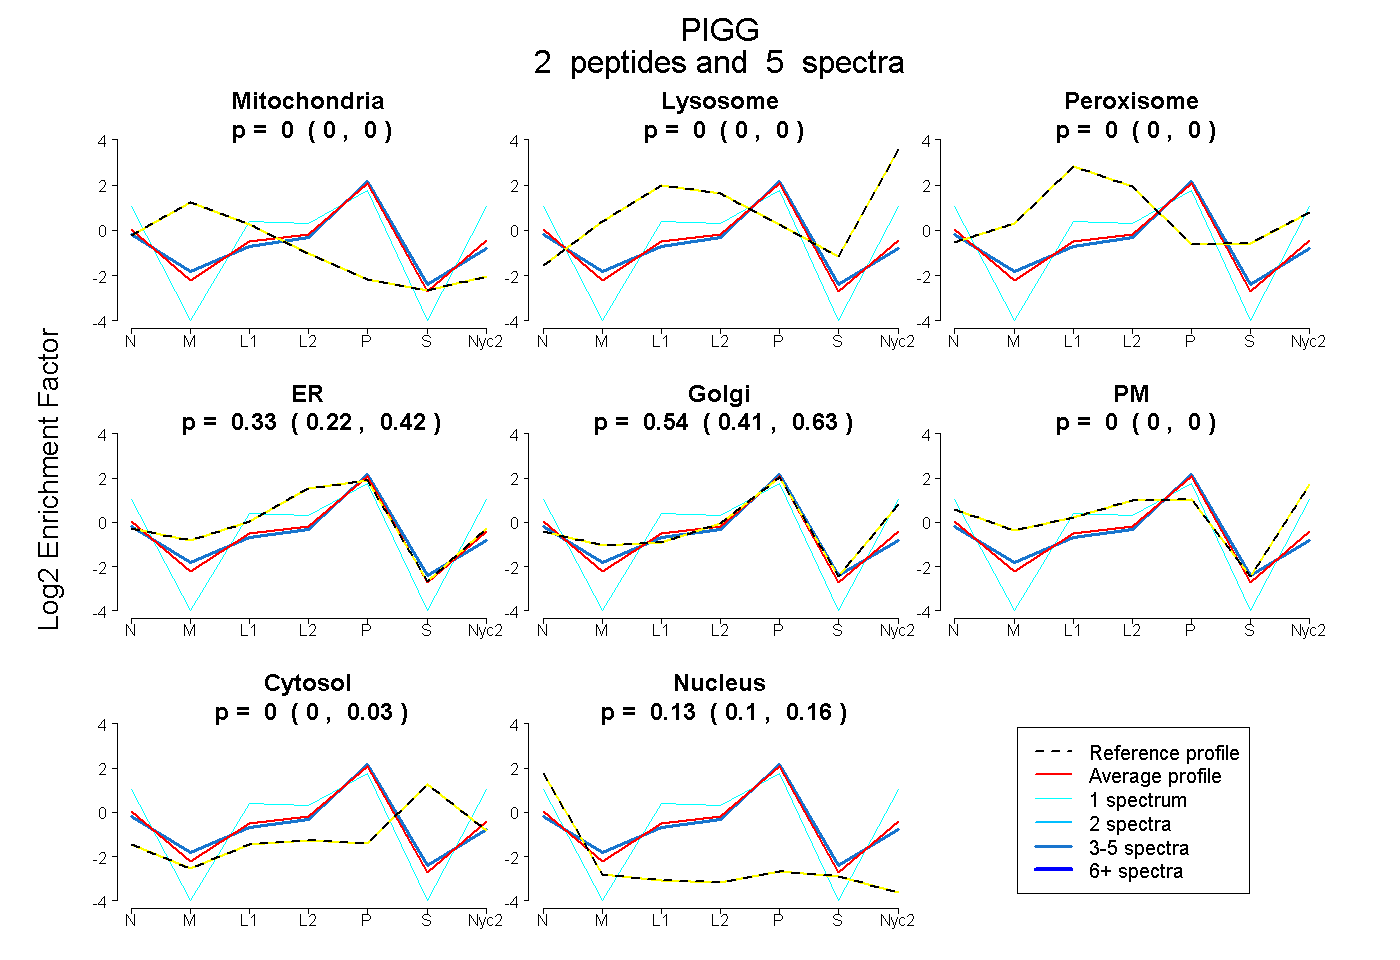
| Plot | Mito | Lyso | Perox | ER | Golgi | PM | Cytosol | Nucleus | |||||
| Expt A |
2 peptides |
5 spectra |
|
0.000 0.000 | 0.000 |
0.000 0.000 | 0.000 |
0.000 0.000 | 0.000 |
0.330 0.223 | 0.420 |
0.535 0.411 | 0.635 |
0.000 0.000 | 0.000 |
0.000 0.000 | 0.029 |
0.135 0.099 | 0.161 |
| 4 spectra, IHTSLLSK | 0.000 | 0.000 | 0.000 | 0.331 | 0.522 | 0.000 | 0.005 | 0.143 | ||
| 1 spectrum, FLHLNTLQLSK | 0.000 | 0.000 | 0.000 | 0.188 | 0.365 | 0.337 | 0.000 | 0.111 |