 4
4peptides
spectra
0.000 | 0.111
0.000 | 0.000
0.000 | 0.072
0.291 | 0.431
0.000 | 0.000
0.000 | 0.000
0.000 | 0.128
0.460 | 0.602
| Plot | Mito | Lyso | Perox | ER | Golgi | PM | Cytosol | Nucleus | |||||
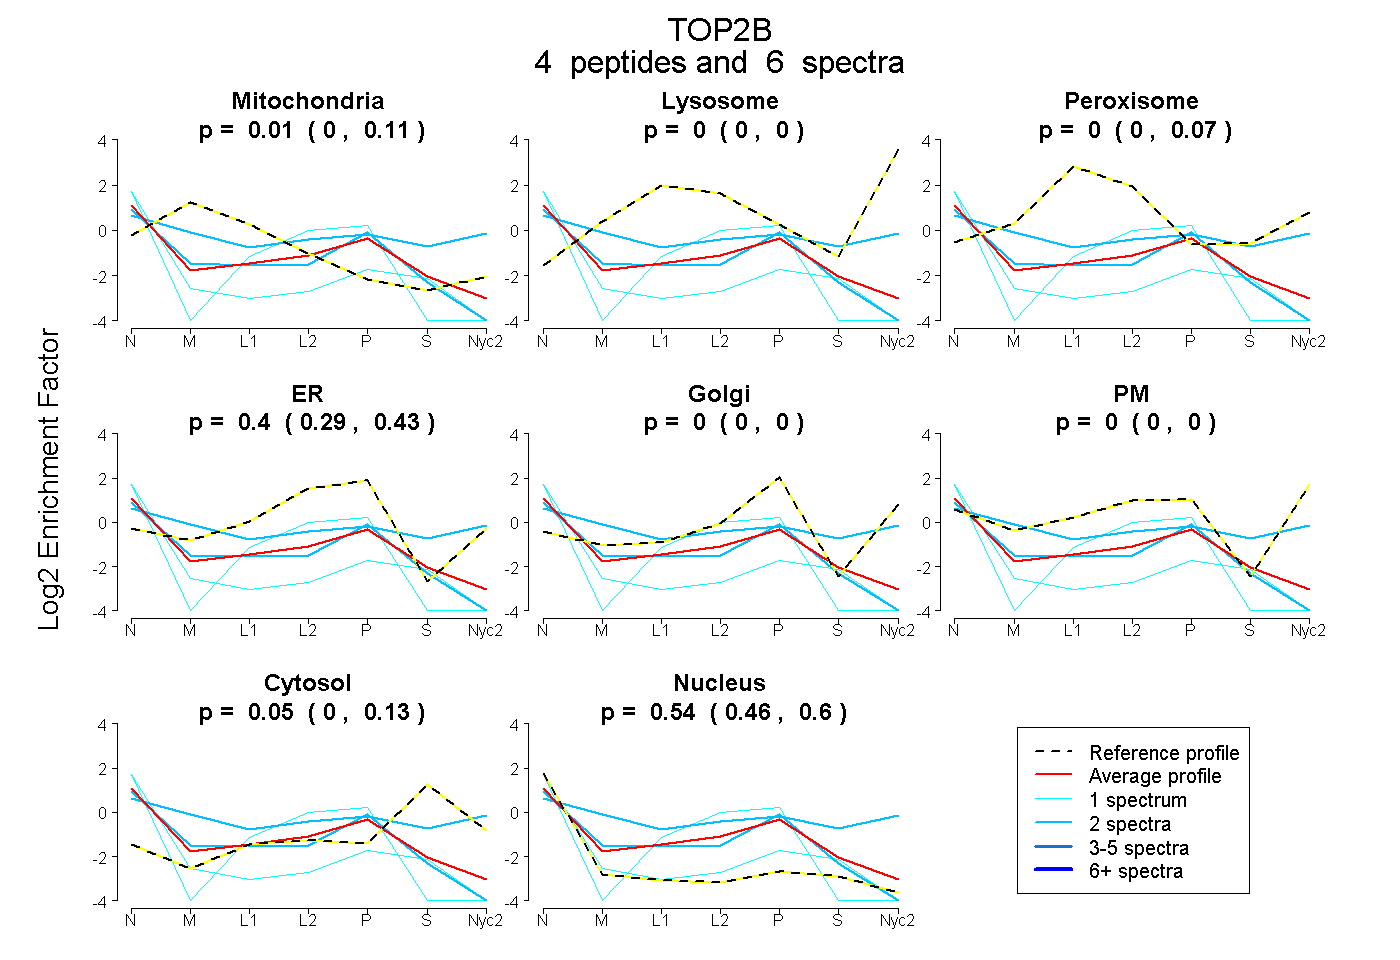
| Expt A |
4 peptides |
6 spectra |
|
0.014 0.000 | 0.111 |
0.000 0.000 | 0.000 |
0.000 0.000 | 0.072 |
0.396 0.291 | 0.431 |
0.000 0.000 | 0.000 |
0.000 0.000 | 0.000 |
0.048 0.000 | 0.128 |
0.542 0.460 | 0.602 |