 2
2peptides
spectra
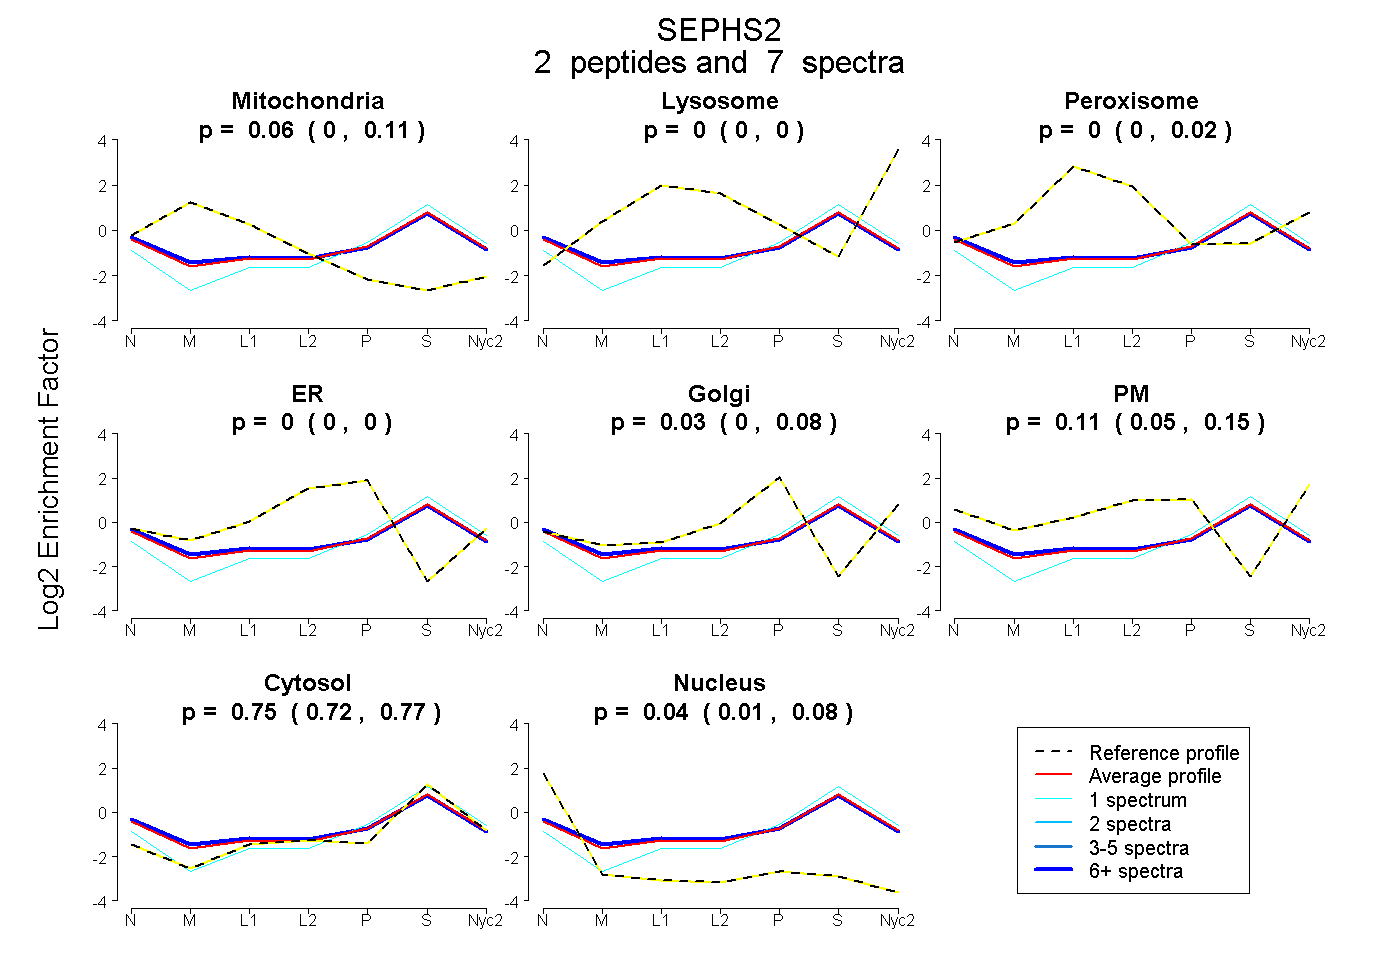
0.000 | 0.109
0.000 | 0.000
0.000 | 0.016
0.000 | 0.000
0.000 | 0.084
0.054 | 0.153
0.717 | 0.774
0.007 | 0.077
2peptides
spectra
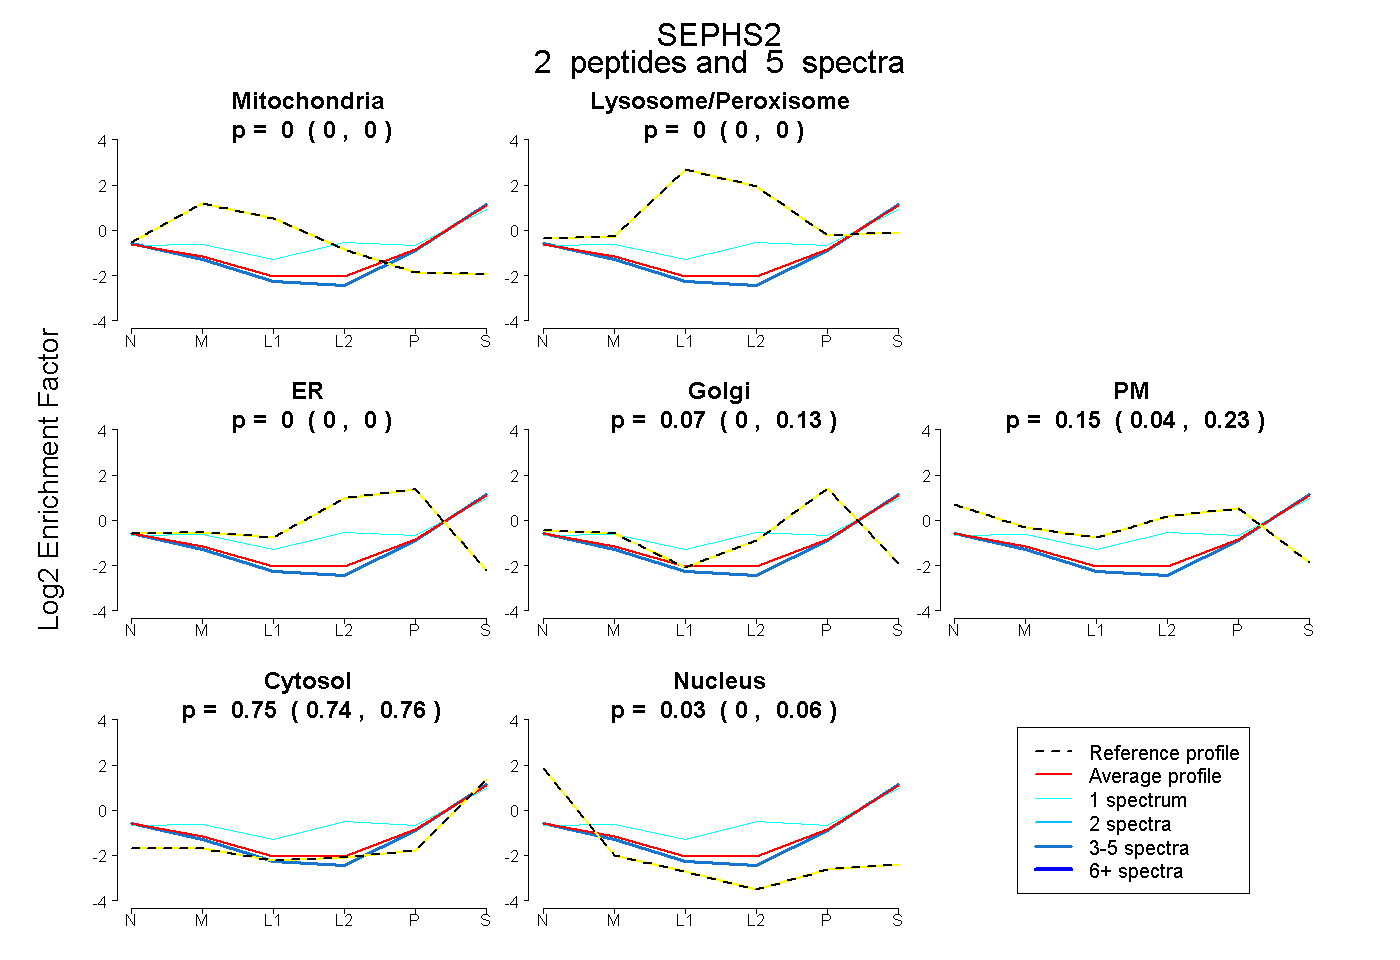
0.000 | 0.000
0.000 | 0.000
0.000 | 0.000
0.000 | 0.134
0.044 | 0.234
0.742 | 0.764
0.000 | 0.065
3peptides
spectra
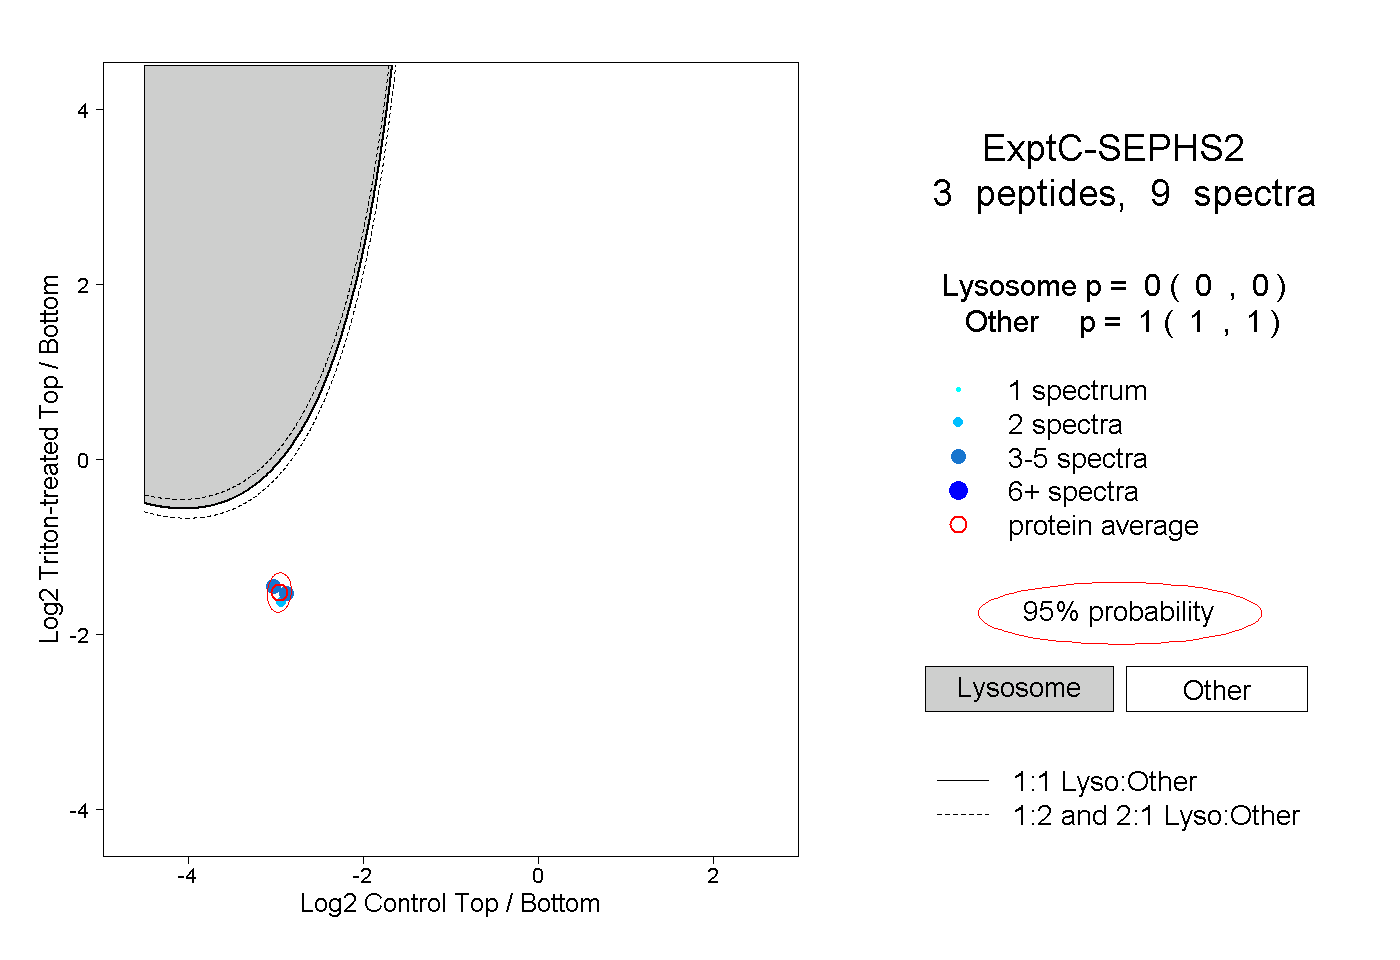
0.000 | 0.000
1.000 | 1.000