 2
2peptides
spectra
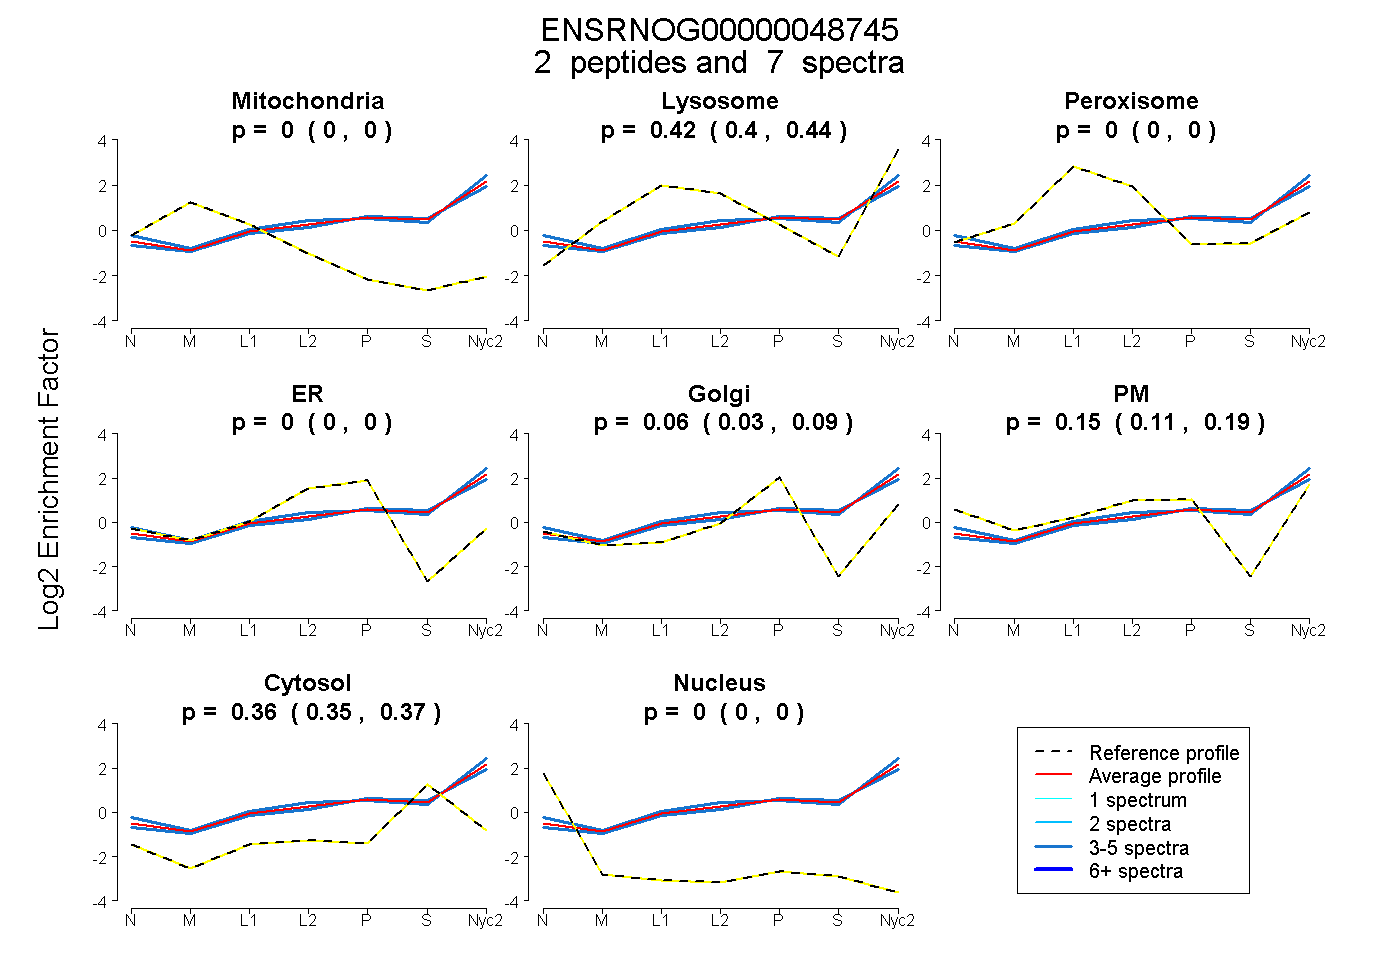
0.000 | 0.000
0.401 | 0.438
0.000 | 0.000
0.000 | 0.000
0.032 | 0.089
0.110 | 0.188
0.355 | 0.370
0.000 | 0.000
1peptide
spectra
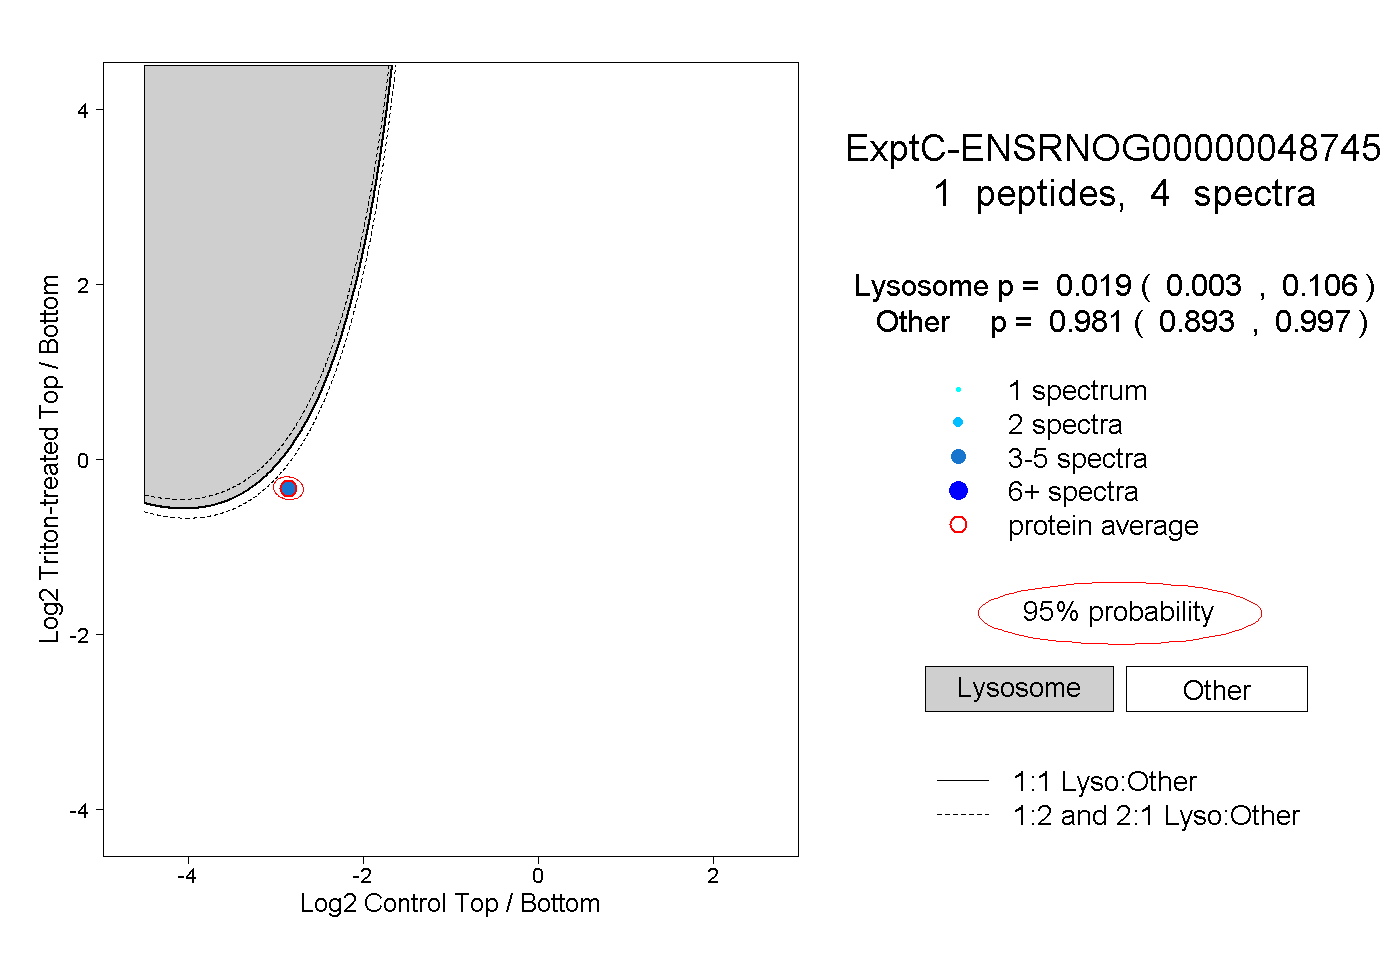
0.003 | 0.106
0.893 | 0.997
1peptide
spectra
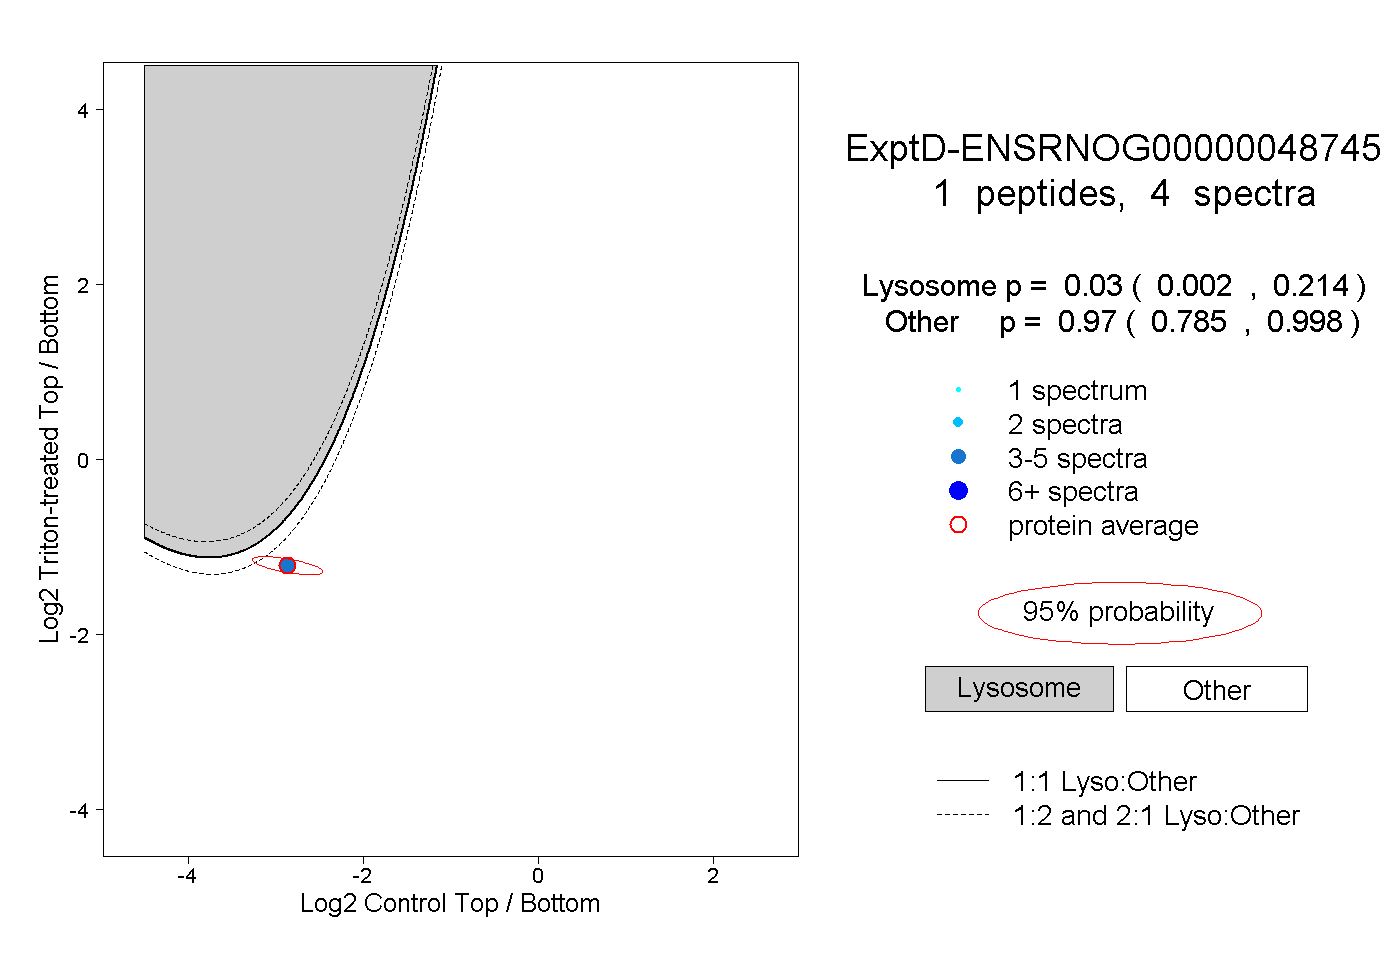
0.002 | 0.214
0.785 | 0.998