 2
2peptides
spectra
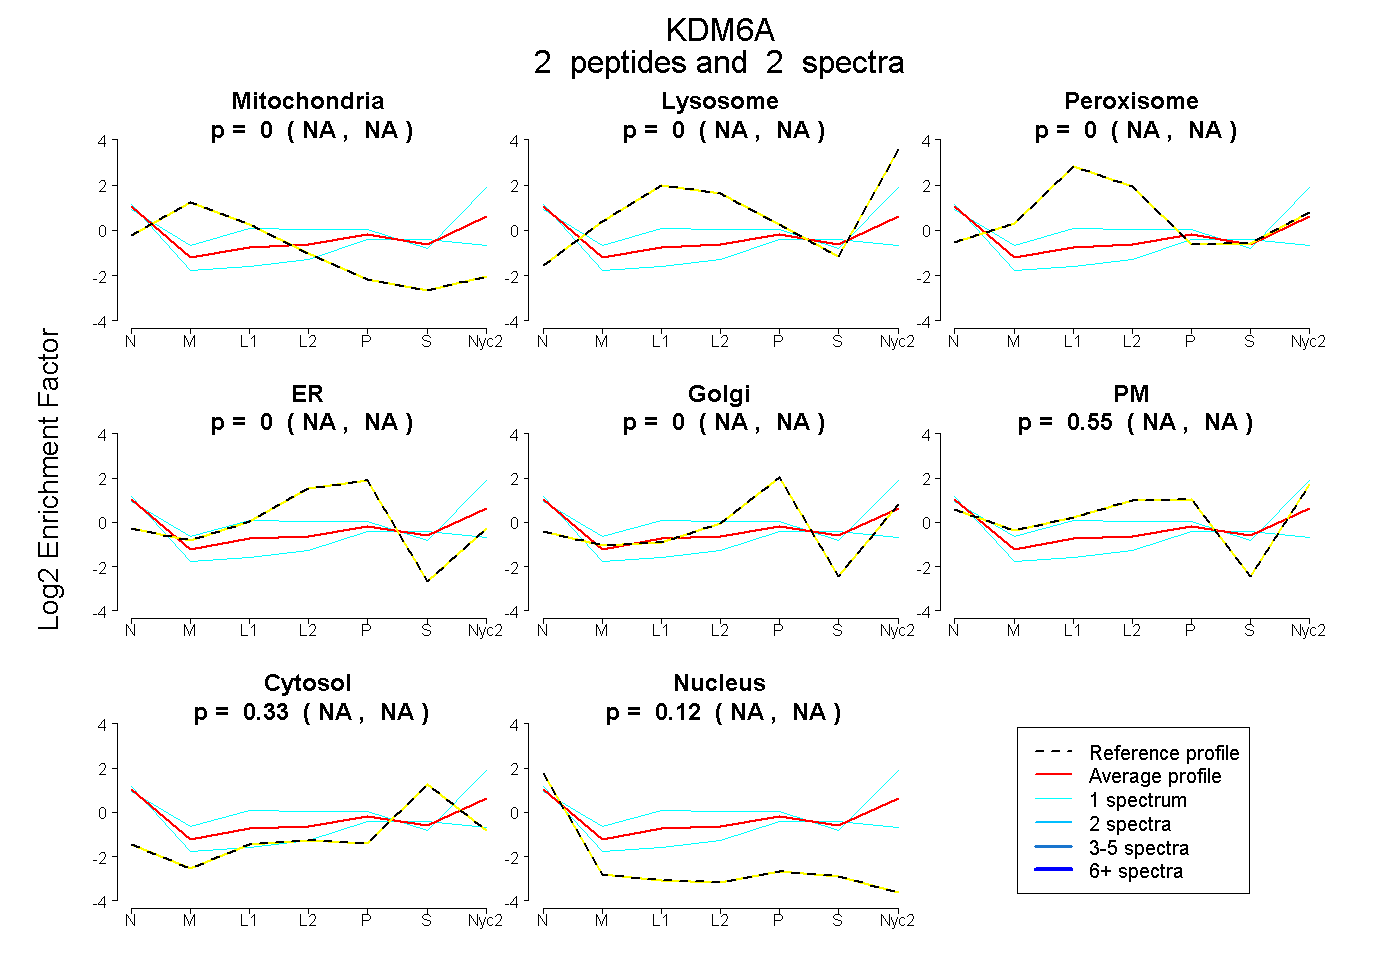
NA | NA
NA | NA
NA | NA
NA | NA
NA | NA
NA | NA
NA | NA
NA | NA
| Plot | Mito | Lyso | Perox | ER | Golgi | PM | Cytosol | Nucleus | |||||
| Expt A |
2 peptides |
2 spectra |
|
0.000 NA | NA |
0.000 NA | NA |
0.000 NA | NA |
0.000 NA | NA |
0.000 NA | NA |
0.551 NA | NA |
0.332 NA | NA |
0.117 NA | NA |
| 1 spectrum, EIIWHGR | 0.000 | 0.121 | 0.000 | 0.000 | 0.000 | 0.637 | 0.229 | 0.013 | ||
| 1 spectrum, LGLMFK | 0.000 | 0.000 | 0.000 | 0.000 | 0.000 | 0.338 | 0.382 | 0.279 |