7
7peptides
spectra
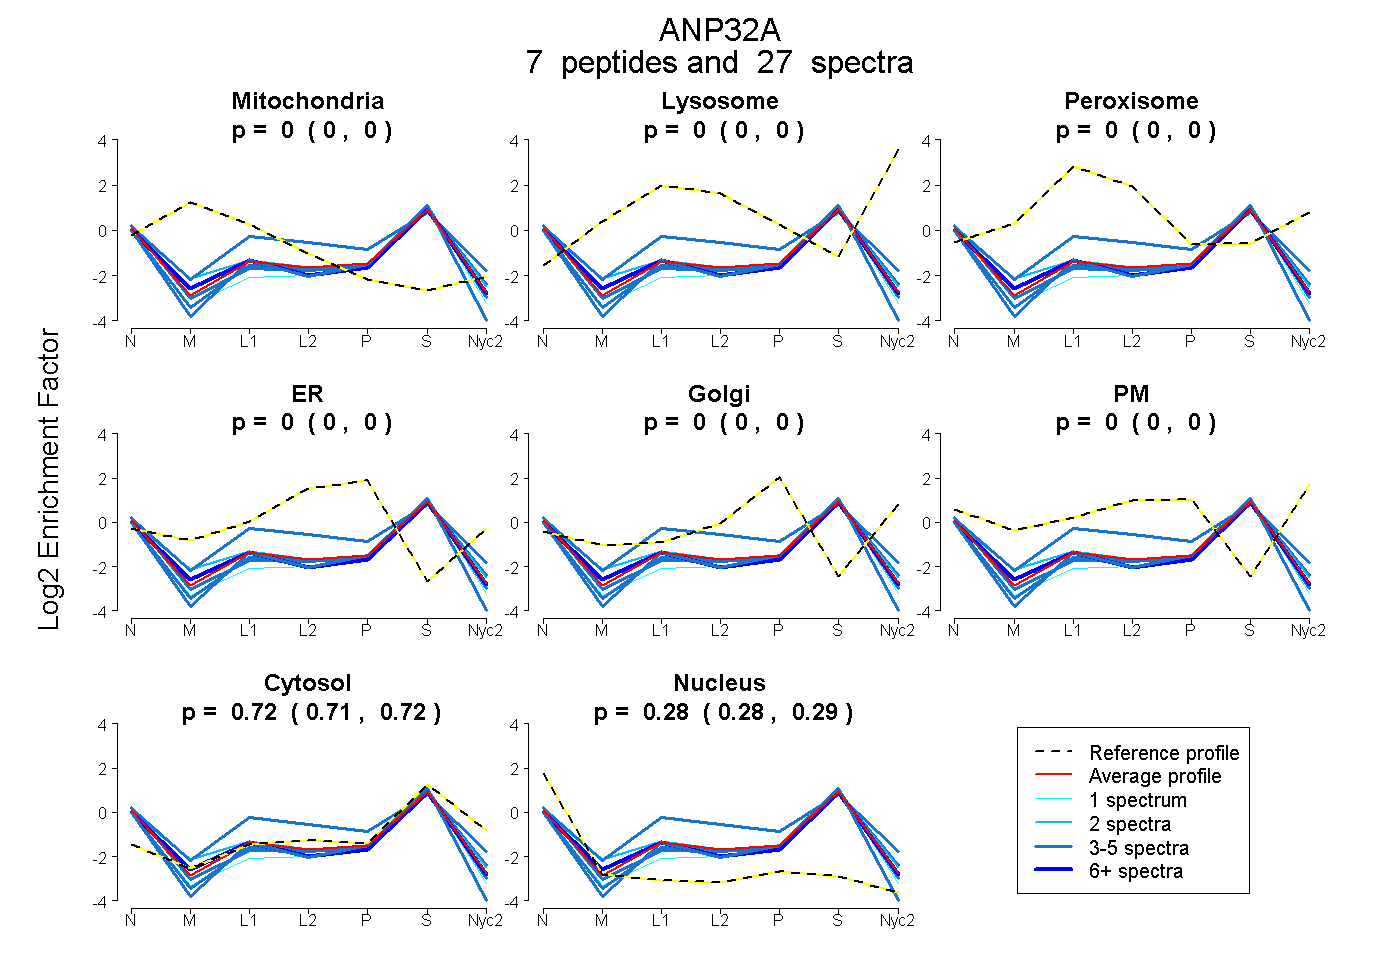
0.000 | 0.000
0.000 | 0.000
0.000 | 0.000
0.000 | 0.000
0.000 | 0.000
0.000 | 0.000
0.708 | 0.723
0.276 | 0.291
5peptides
spectra
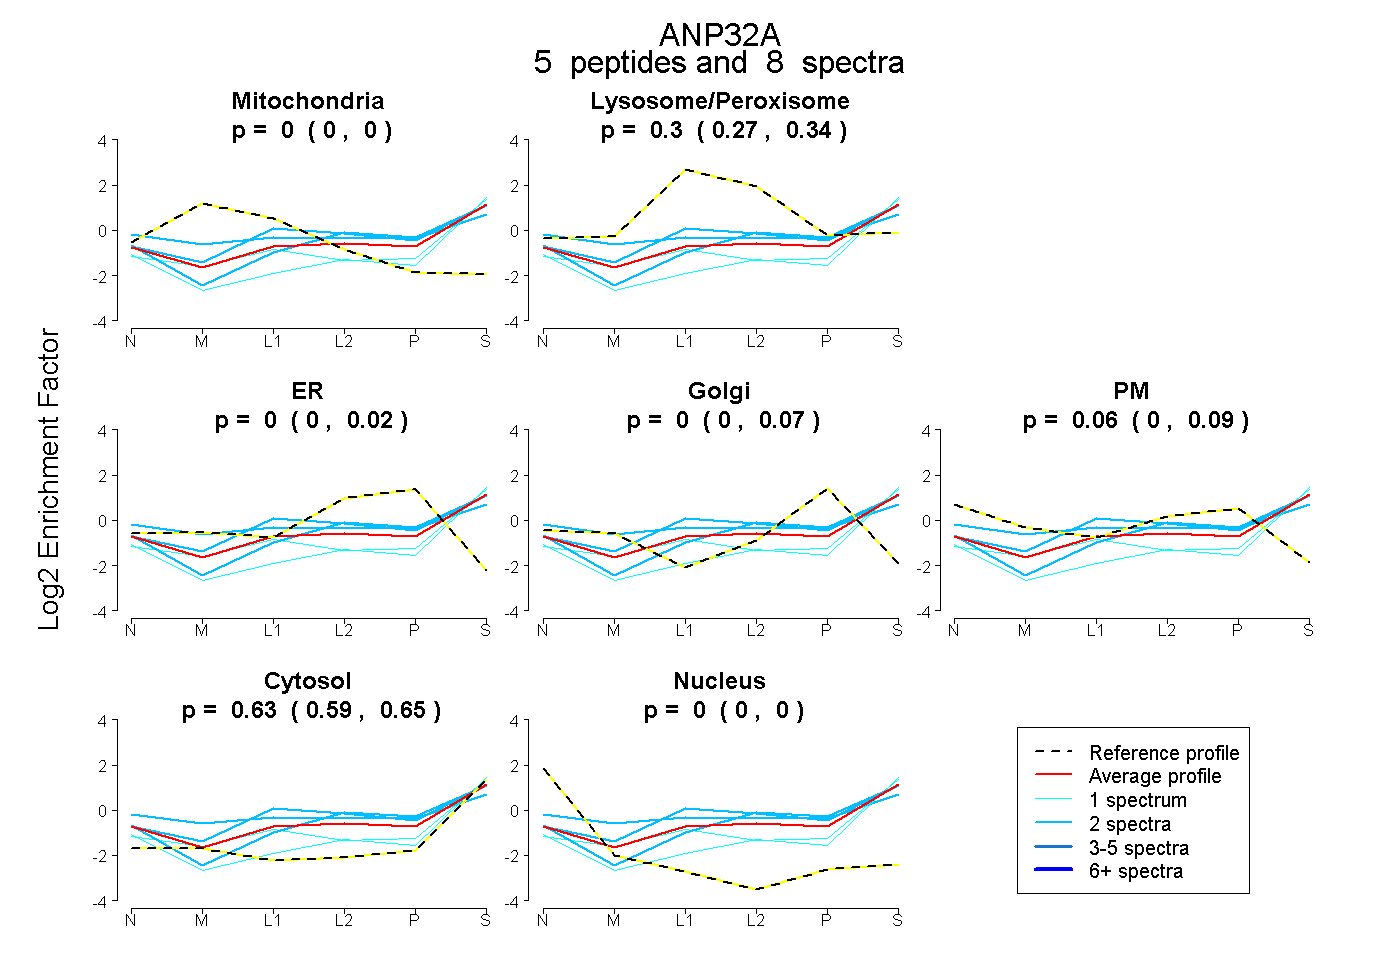
0.000 | 0.000
0.267 | 0.343
0.000 | 0.016
0.000 | 0.065
0.000 | 0.091
0.593 | 0.650
0.000 | 0.000
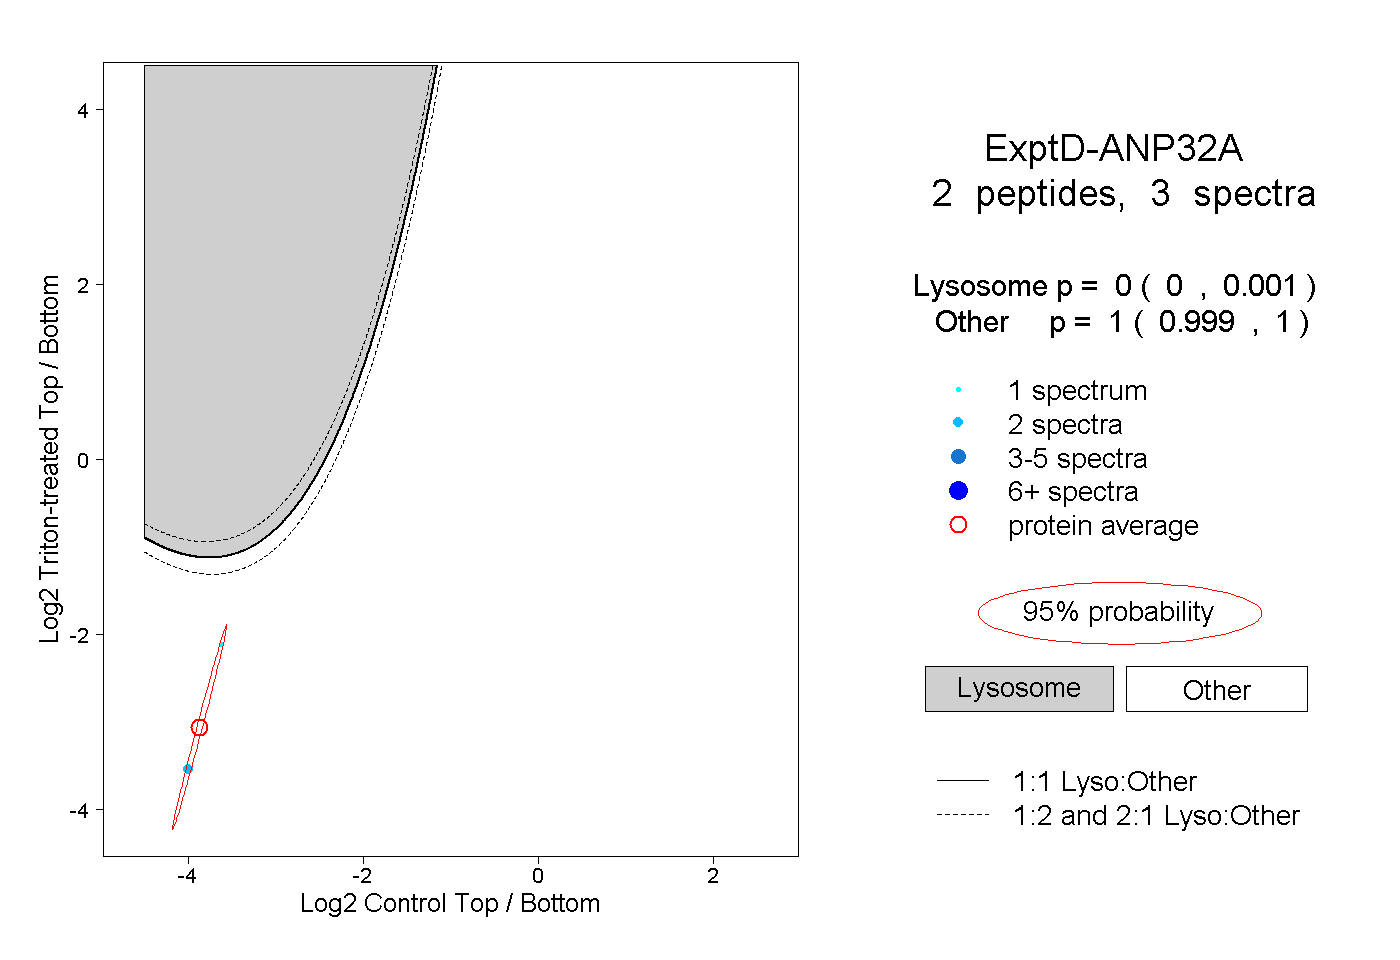
9peptides
spectra
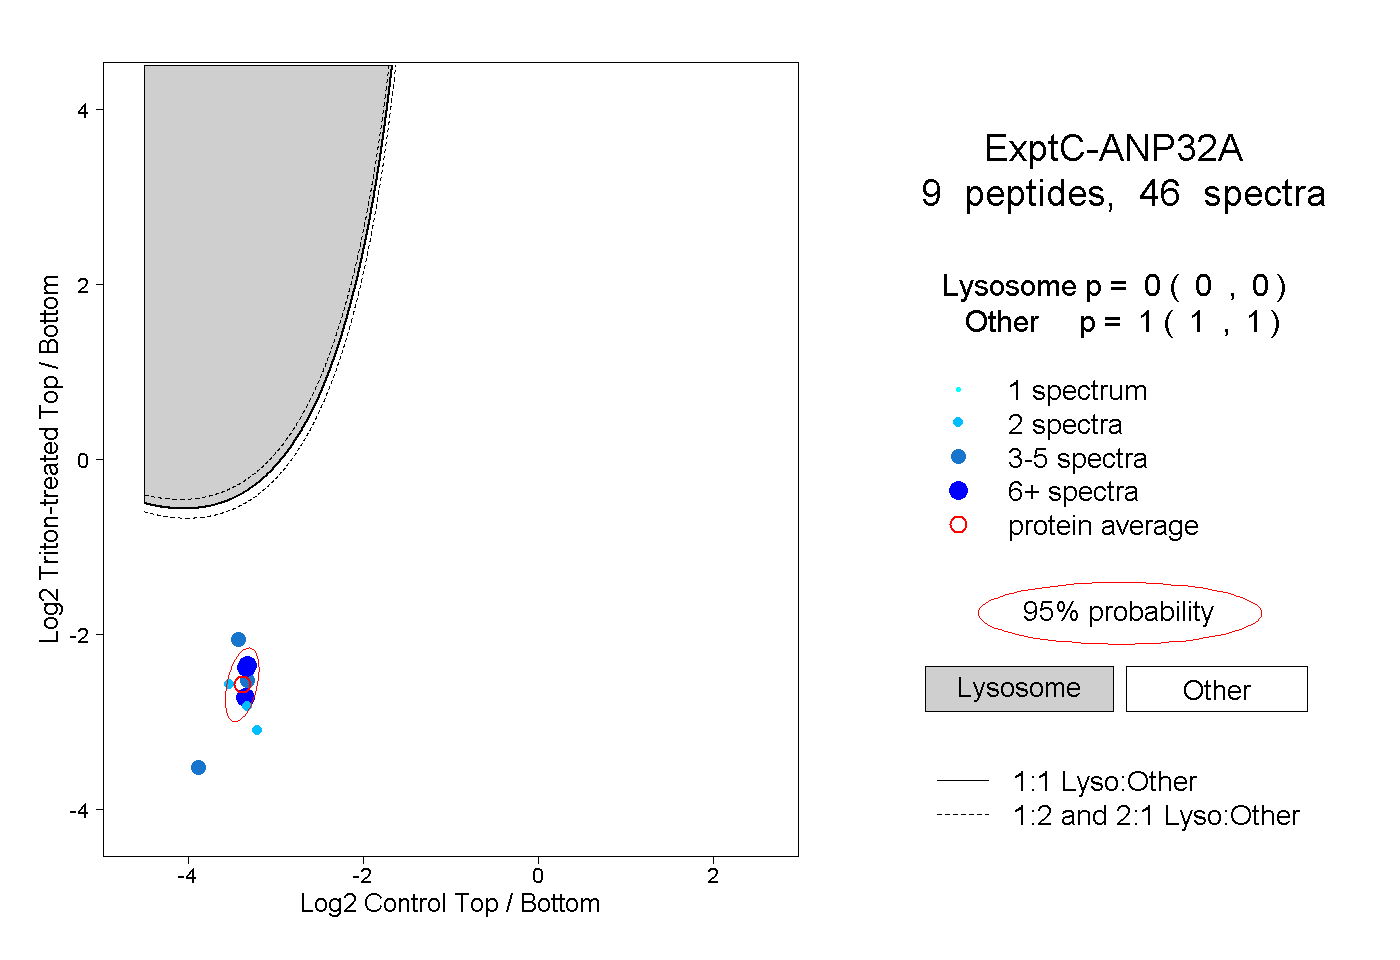
0.000 | 0.000
1.000 | 1.000