 7
7peptides
spectra
0.000 | 0.000
0.000 | 0.000
0.000 | 0.000
0.000 | 0.000
0.000 | 0.000
0.000 | 0.000
0.708 | 0.723
0.276 | 0.291
| Plot | Mito | Lyso | Perox | ER | Golgi | PM | Cytosol | Nucleus | |||||
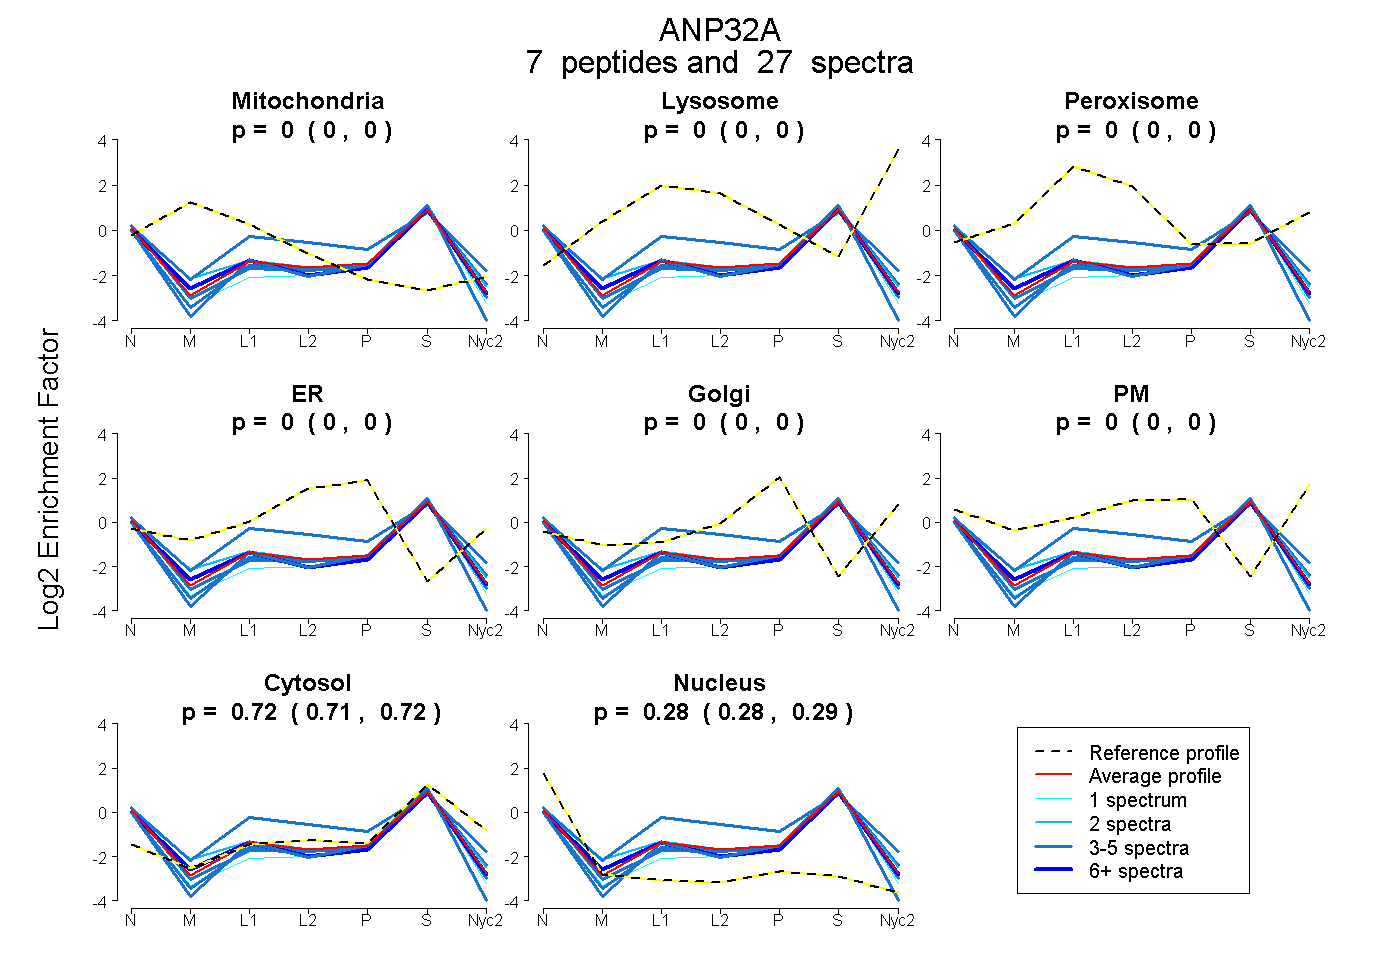
| Expt A |
7 peptides |
27 spectra |
|
0.000 0.000 | 0.000 |
0.000 0.000 | 0.000 |
0.000 0.000 | 0.000 |
0.000 0.000 | 0.000 |
0.000 0.000 | 0.000 |
0.000 0.000 | 0.000 |
0.716 0.708 | 0.723 |
0.284 0.276 | 0.291 |
| 8 spectra, LLPQVMYLDGYDR | 0.000 | 0.000 | 0.000 | 0.000 | 0.000 | 0.000 | 0.697 | 0.303 | ||
| 1 spectrum, DISTLEPLK | 0.000 | 0.000 | 0.000 | 0.000 | 0.000 | 0.000 | 0.651 | 0.349 | ||
| 3 spectra, SLDLFNCEVTNLNAYR | 0.000 | 0.000 | 0.000 | 0.000 | 0.000 | 0.000 | 0.632 | 0.368 | ||
| 5 spectra, ELVLDNCR | 0.000 | 0.000 | 0.000 | 0.000 | 0.000 | 0.000 | 0.703 | 0.297 | ||
| 4 spectra, LELSENR | 0.000 | 0.000 | 0.250 | 0.008 | 0.000 | 0.000 | 0.564 | 0.178 | ||
| 2 spectra, HLNLSGNK | 0.037 | 0.000 | 0.024 | 0.000 | 0.000 | 0.000 | 0.684 | 0.255 | ||
| 4 spectra, ISGDLEVLAEK | 0.000 | 0.000 | 0.000 | 0.000 | 0.000 | 0.000 | 0.702 | 0.298 |
| Plot | Mito | Lyso or Perox | ER | Golgi | PM | Cytosol | Nucleus | ||||||
| Expt B |
5 peptides |
8 spectra |
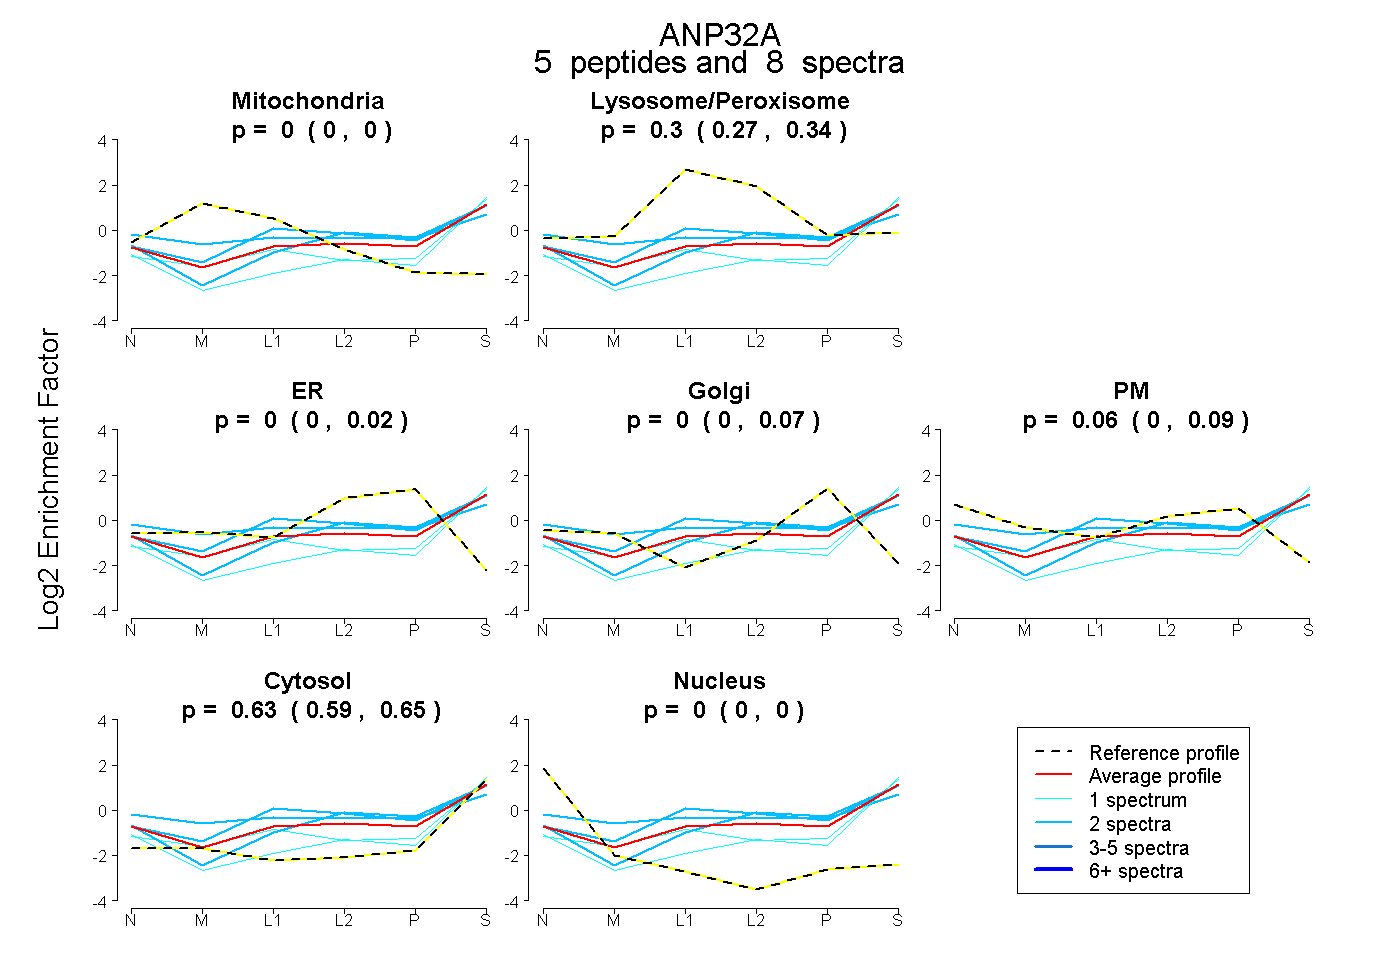 |
0.000 0.000 | 0.000 |
0.304 0.267 | 0.343 |
0.000 0.000 | 0.016 |
0.003 0.000 | 0.065 |
0.064 0.000 | 0.091 |
0.629 0.593 | 0.650 |
0.000 0.000 | 0.000 |
|||
| Plot | Lyso | Other | |||||||||||
| Expt C |
9 peptides |
46 spectra |
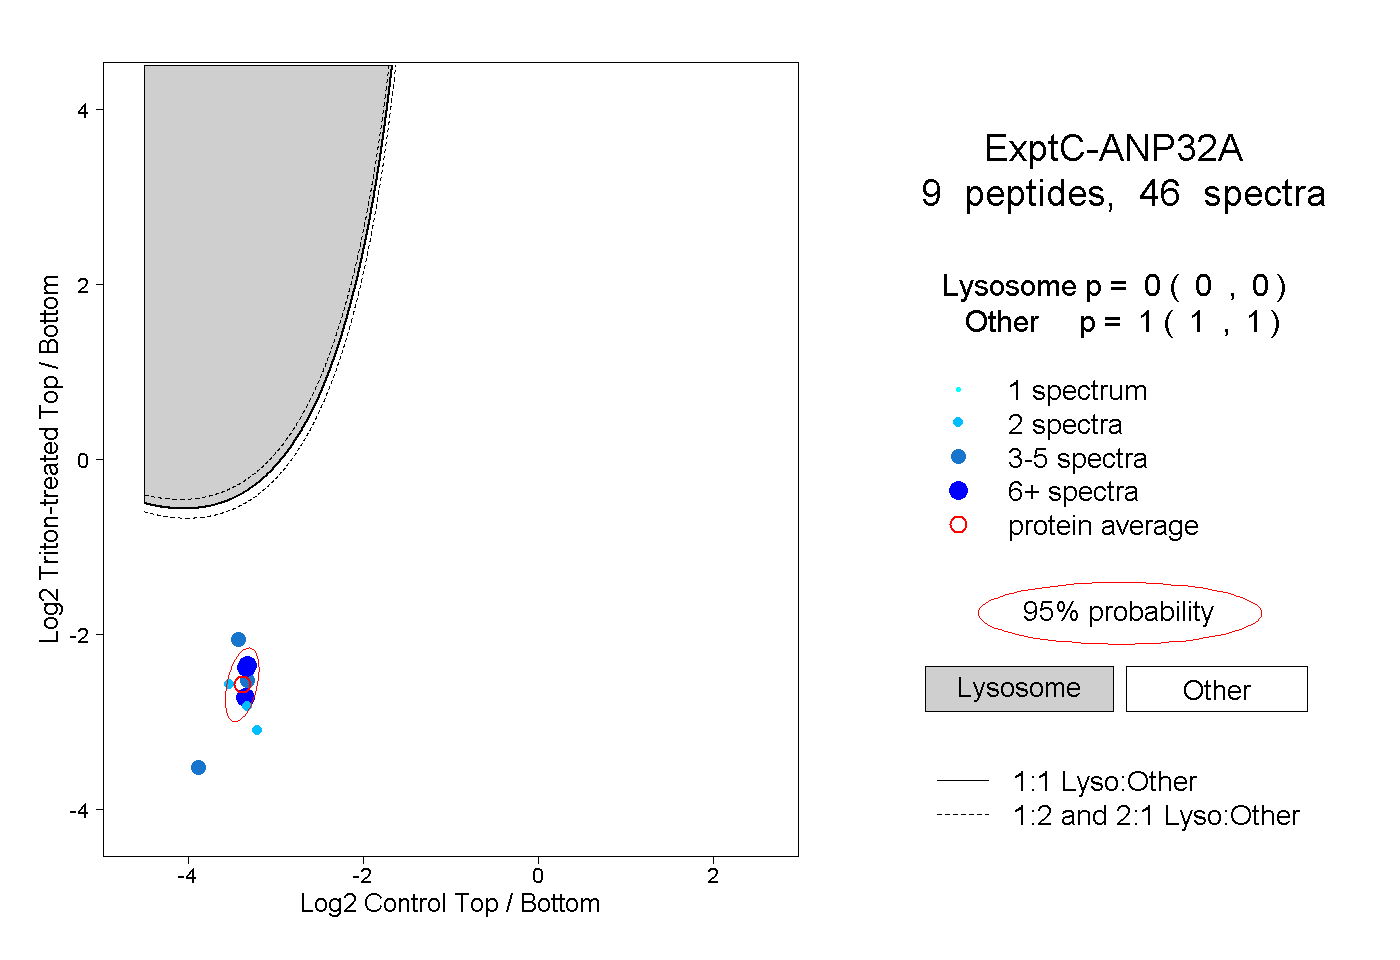 |
0.000 0.000 | 0.000 |
1.000 1.000 | 1.000 |
||||||||
| Plot | Lyso | Other | |||||||||||
| Expt D |
2 peptides |
3 spectra |
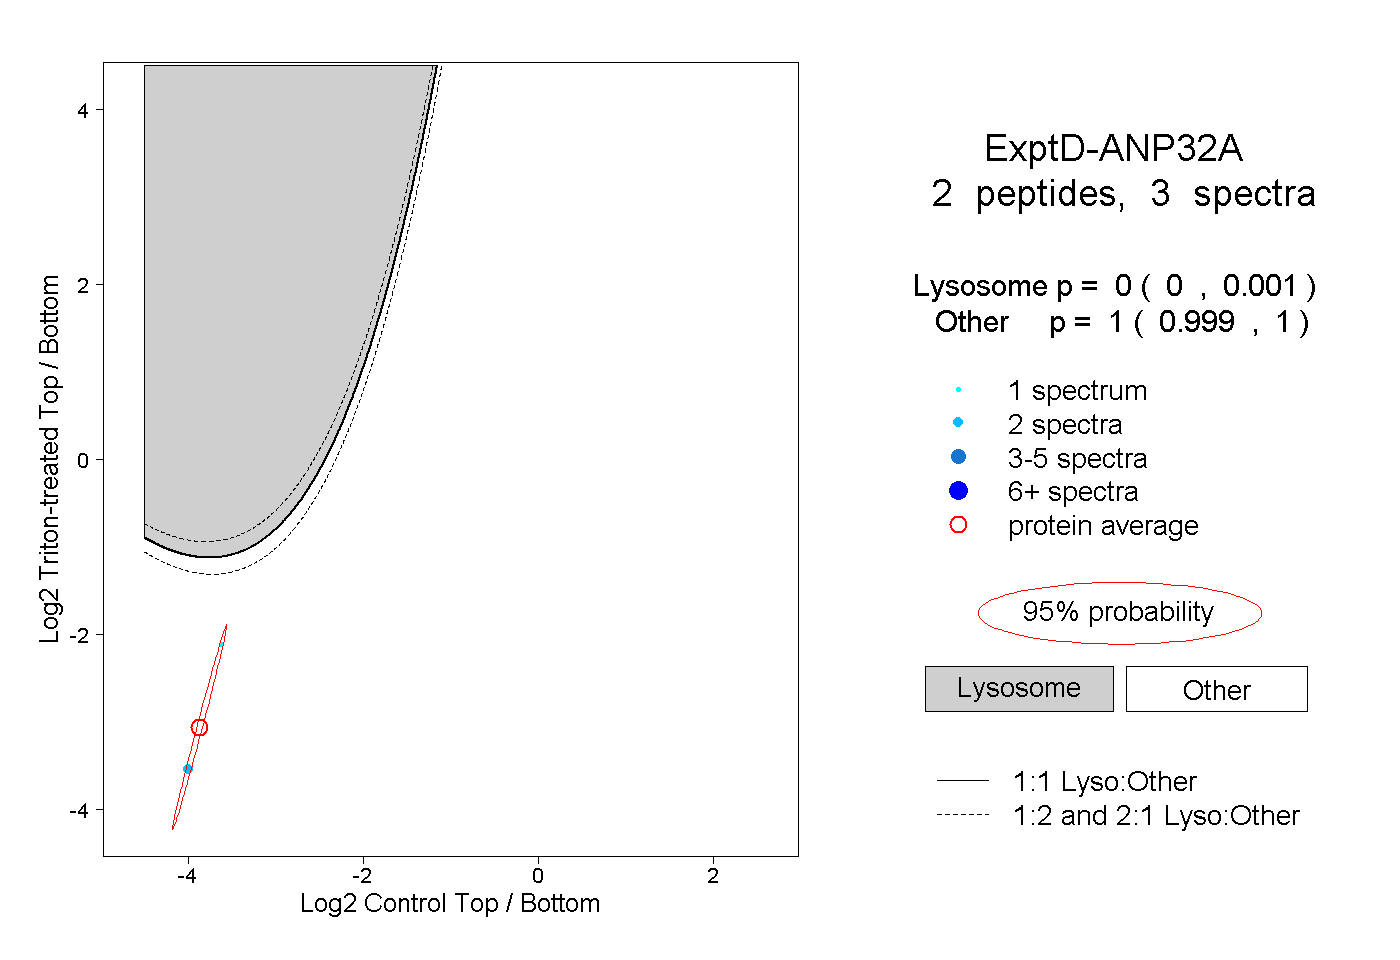 |
0.000 0.000 | 0.001 |
1.000 0.999 | 1.000 |