16
16peptides
spectra
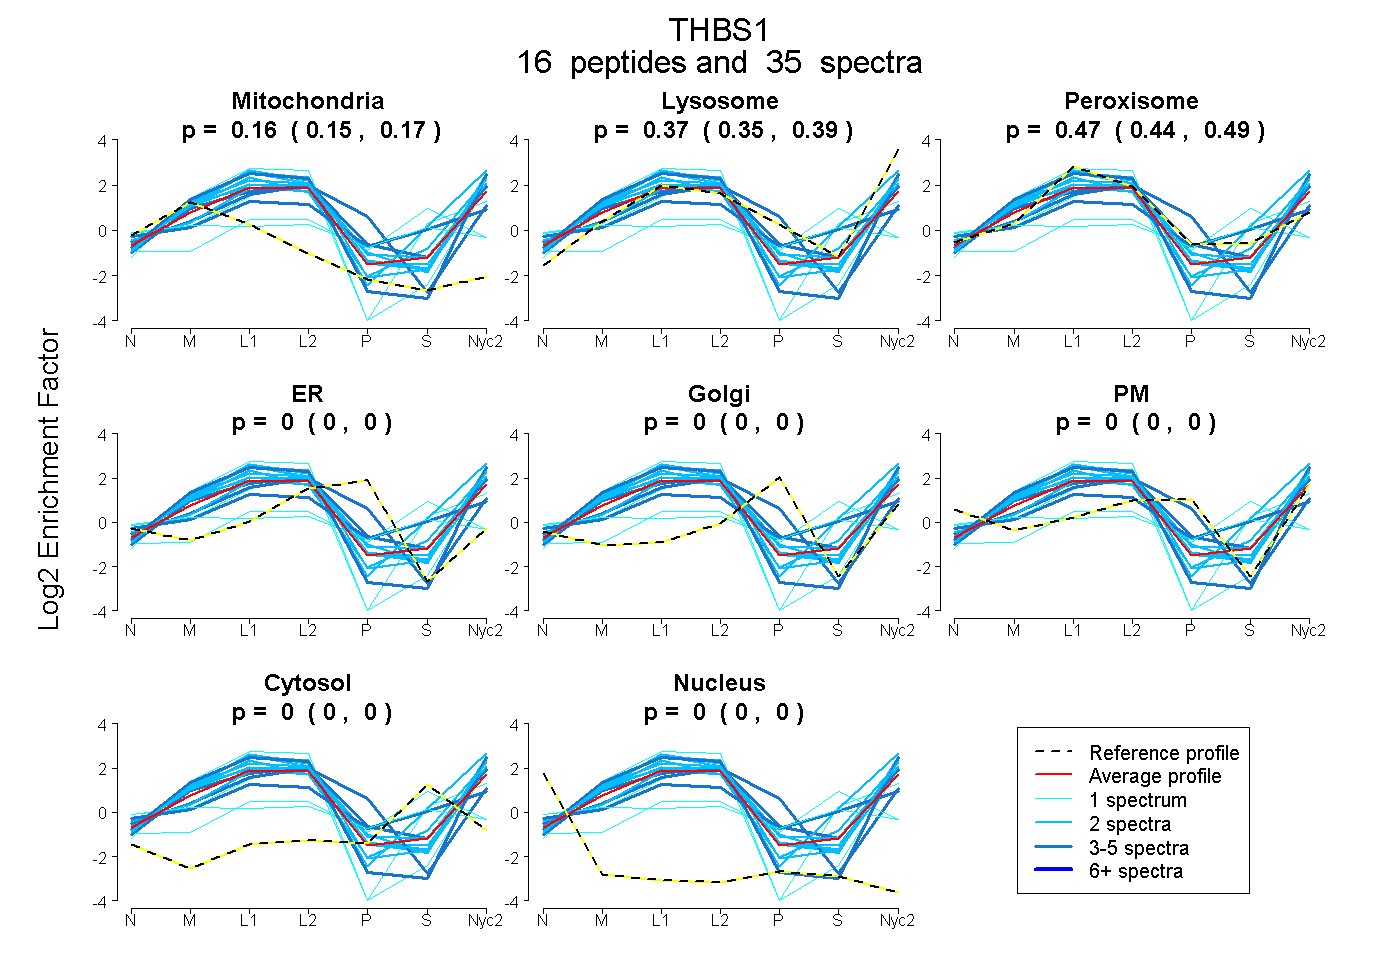
0.149 | 0.171
0.352 | 0.392
0.439 | 0.488
0.000 | 0.000
0.000 | 0.000
0.000 | 0.000
0.000 | 0.000
0.000 | 0.000
5peptides
spectra
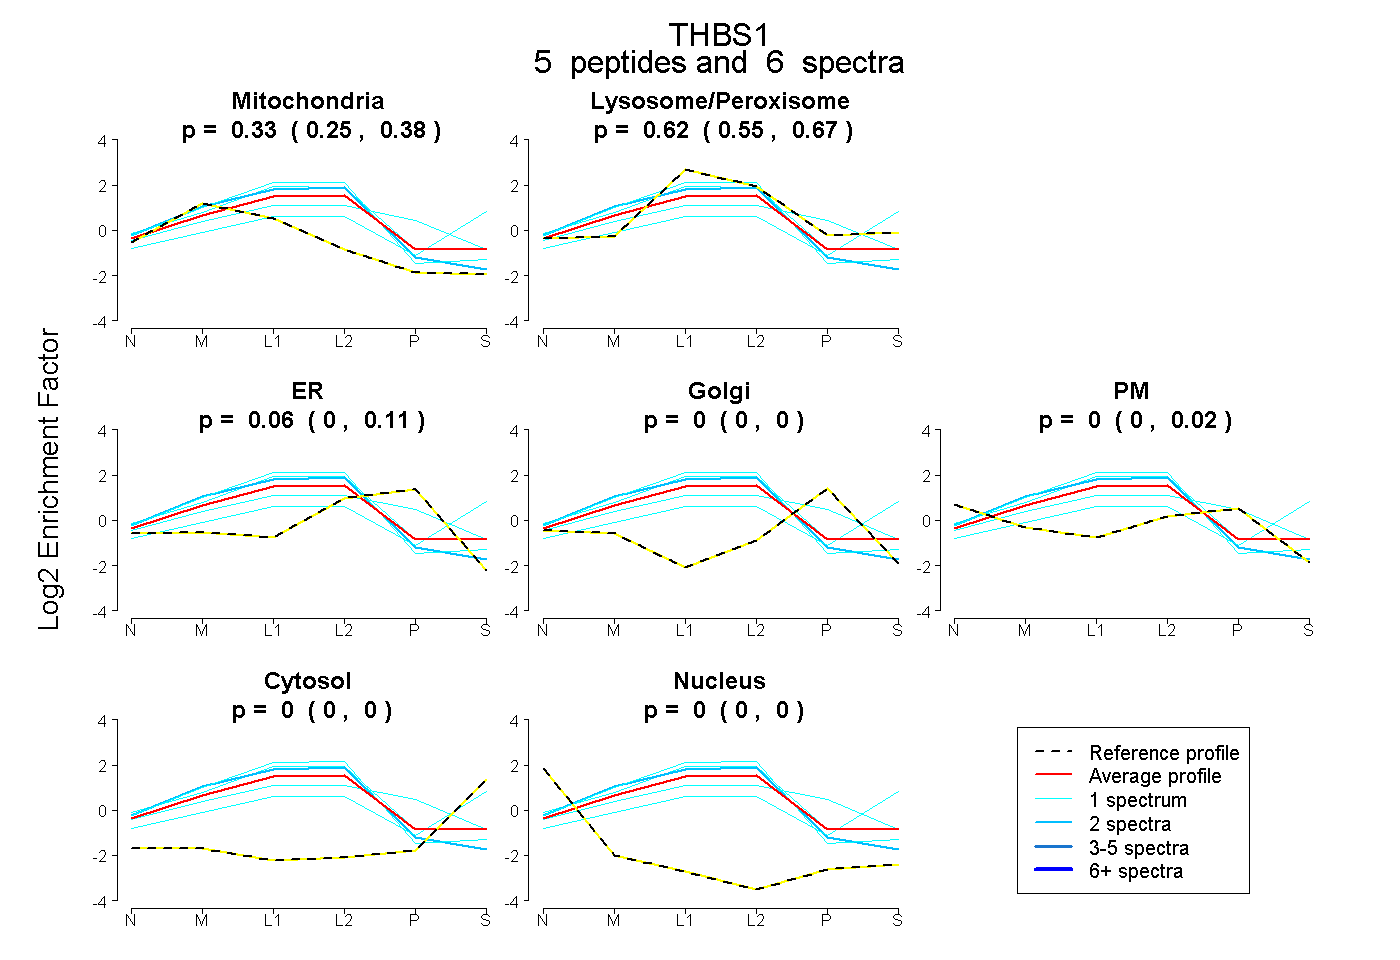
0.253 | 0.380
0.548 | 0.671
0.000 | 0.113
0.000 | 0.000
0.000 | 0.021
0.000 | 0.003
0.000 | 0.000