 16
16peptides
spectra
0.149 | 0.171
0.352 | 0.392
0.439 | 0.488
0.000 | 0.000
0.000 | 0.000
0.000 | 0.000
0.000 | 0.000
0.000 | 0.000
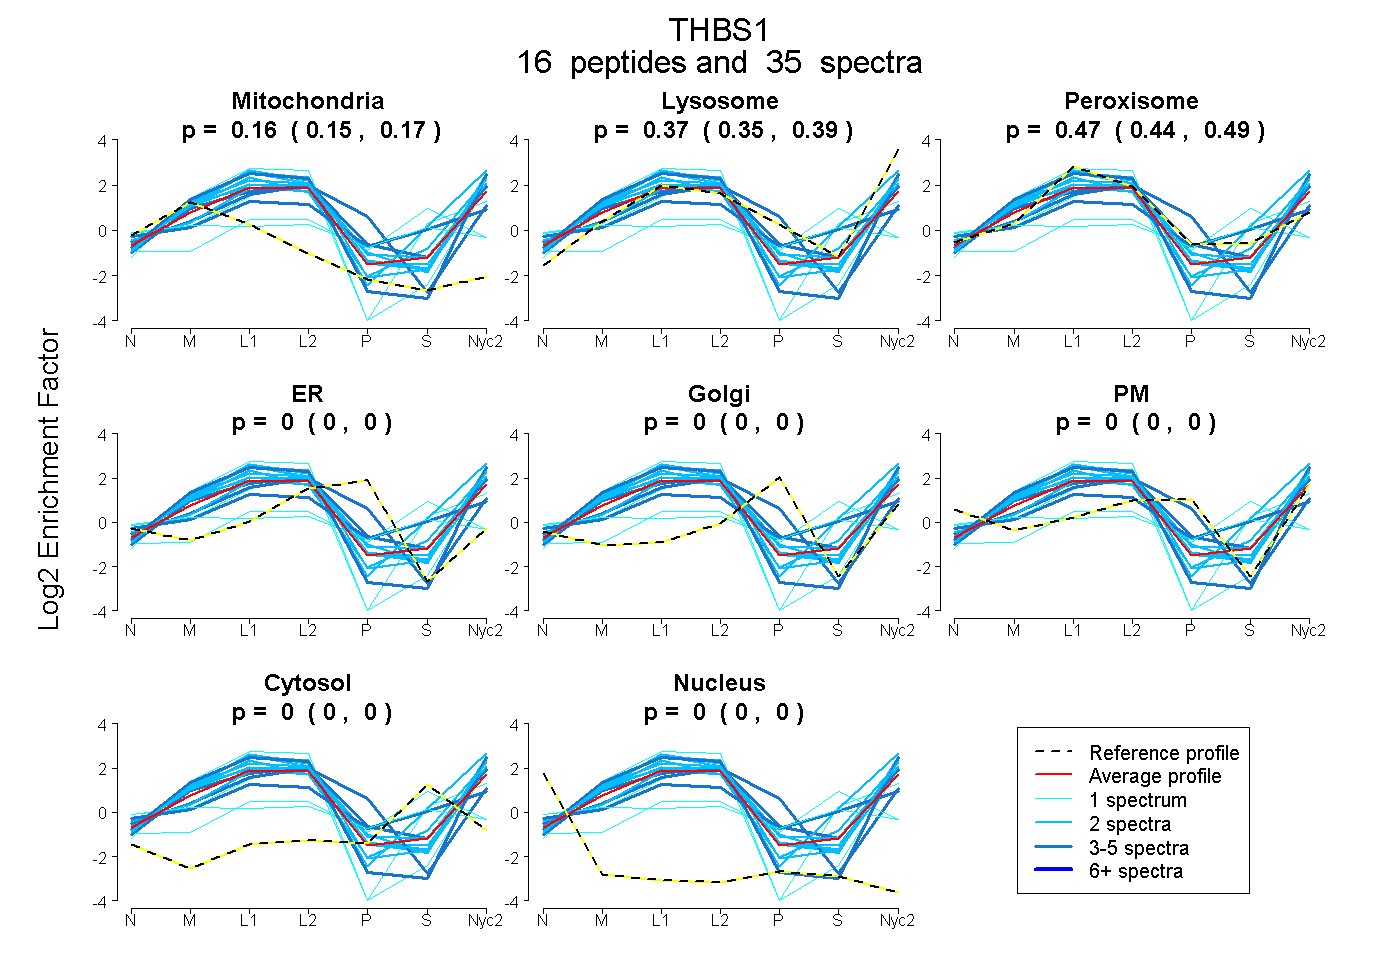
| Plot | Mito | Lyso | Perox | ER | Golgi | PM | Cytosol | Nucleus | |||||
| Expt A |
16 peptides |
35 spectra |
|
0.161 0.149 | 0.171 |
0.374 0.352 | 0.392 |
0.466 0.439 | 0.488 |
0.000 0.000 | 0.000 |
0.000 0.000 | 0.000 |
0.000 0.000 | 0.000 |
0.000 0.000 | 0.000 |
0.000 0.000 | 0.000 |
| 2 spectra, TYAGGR | 0.130 | 0.540 | 0.329 | 0.000 | 0.000 | 0.000 | 0.000 | 0.000 | ||
| 1 spectrum, DCVGDVTENQVCNK | 0.201 | 0.272 | 0.527 | 0.000 | 0.000 | 0.000 | 0.000 | 0.000 | ||
| 3 spectra, QVTQSYWDTNPTR | 0.232 | 0.550 | 0.219 | 0.000 | 0.000 | 0.000 | 0.000 | 0.000 | ||
| 2 spectra, GTSQNDPNWVVR | 0.097 | 0.450 | 0.453 | 0.000 | 0.000 | 0.000 | 0.000 | 0.000 | ||
| 2 spectra, FYVVMWK | 0.105 | 0.459 | 0.436 | 0.000 | 0.000 | 0.000 | 0.000 | 0.000 | ||
| 2 spectra, LCNNPTPQFGGK | 0.000 | 0.363 | 0.552 | 0.000 | 0.000 | 0.000 | 0.085 | 0.000 | ||
| 2 spectra, DFTAYR | 0.196 | 0.510 | 0.294 | 0.000 | 0.000 | 0.000 | 0.000 | 0.000 | ||
| 5 spectra, DVDECK | 0.058 | 0.287 | 0.195 | 0.394 | 0.000 | 0.065 | 0.000 | 0.000 | ||
| 4 spectra, NALWHTGNTPGQVR | 0.009 | 0.088 | 0.603 | 0.000 | 0.000 | 0.080 | 0.220 | 0.000 | ||
| 2 spectra, AQGYSGLSVK | 0.076 | 0.571 | 0.353 | 0.000 | 0.000 | 0.000 | 0.000 | 0.000 | ||
| 3 spectra, FTGSQPFGR | 0.118 | 0.518 | 0.364 | 0.000 | 0.000 | 0.000 | 0.000 | 0.000 | ||
| 1 spectrum, CGACPPGYSGNGIQCK | 0.043 | 0.000 | 0.797 | 0.000 | 0.000 | 0.000 | 0.160 | 0.000 | ||
| 2 spectra, DNCQYVYNVDQR | 0.089 | 0.372 | 0.539 | 0.000 | 0.000 | 0.000 | 0.000 | 0.000 | ||
| 2 spectra, DDDYAGFVFGYQSSSR | 0.107 | 0.396 | 0.497 | 0.000 | 0.000 | 0.000 | 0.000 | 0.000 | ||
| 1 spectrum, EVPDACFNHNGEHR | 0.000 | 0.000 | 0.472 | 0.000 | 0.000 | 0.000 | 0.528 | 0.000 | ||
| 1 spectrum, NTDPGYNCLPCPPR | 0.199 | 0.000 | 0.350 | 0.000 | 0.000 | 0.113 | 0.338 | 0.000 |
| Plot | Mito | Lyso or Perox | ER | Golgi | PM | Cytosol | Nucleus | ||||||
| Expt B |
5 peptides |
6 spectra |
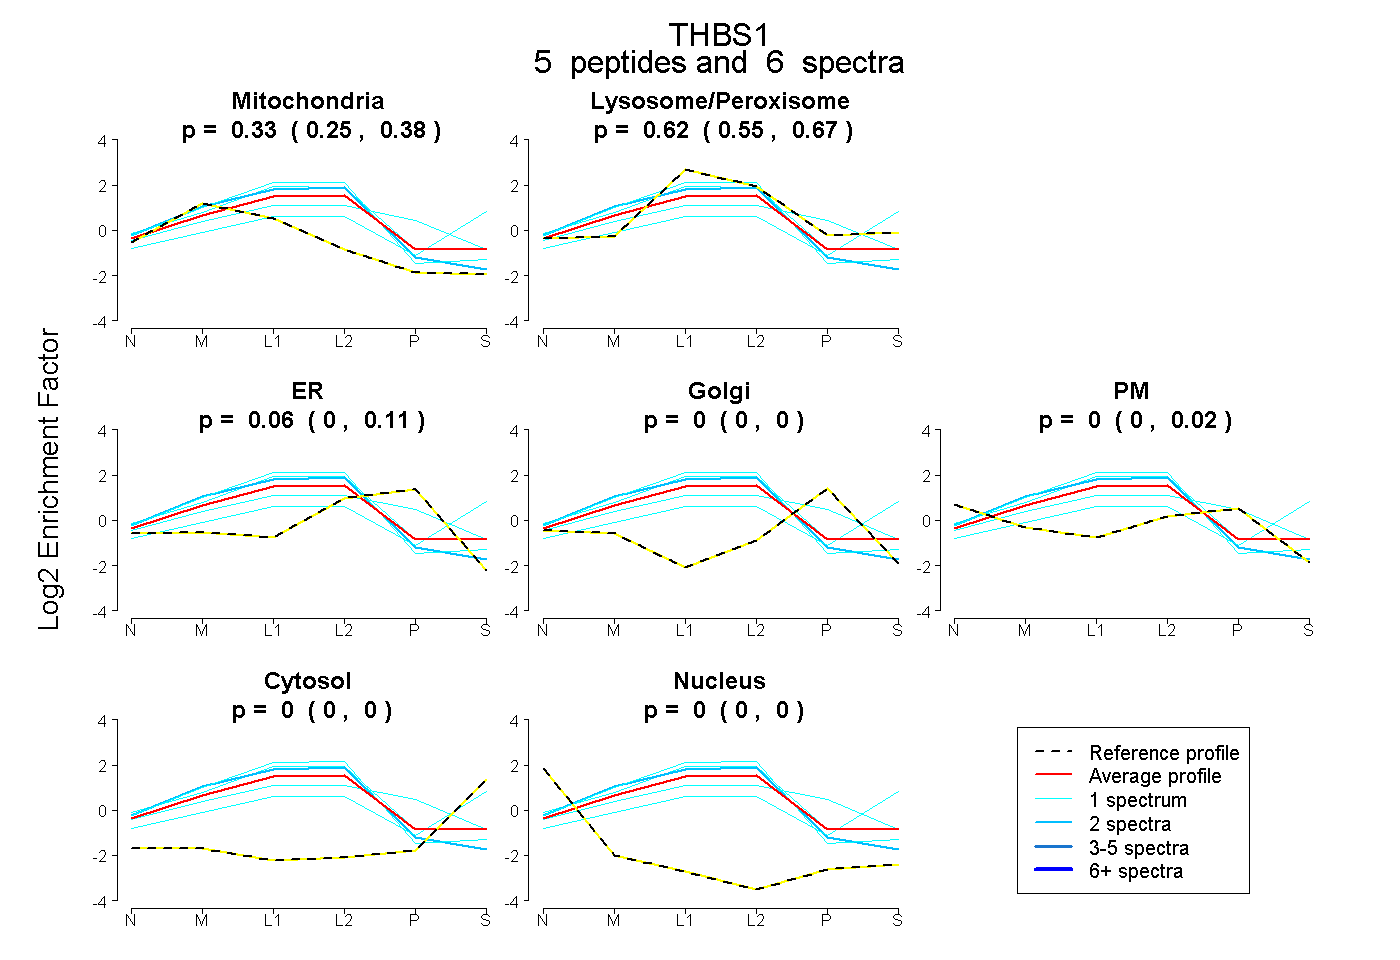 |
0.325 0.253 | 0.380 |
0.618 0.548 | 0.671 |
0.057 0.000 | 0.113 |
0.000 0.000 | 0.000 |
0.000 0.000 | 0.021 |
0.000 0.000 | 0.003 |
0.000 0.000 | 0.000 |
|||
| Plot | Lyso | Other | |||||||||||
| Expt C |
21 peptides |
121 spectra |
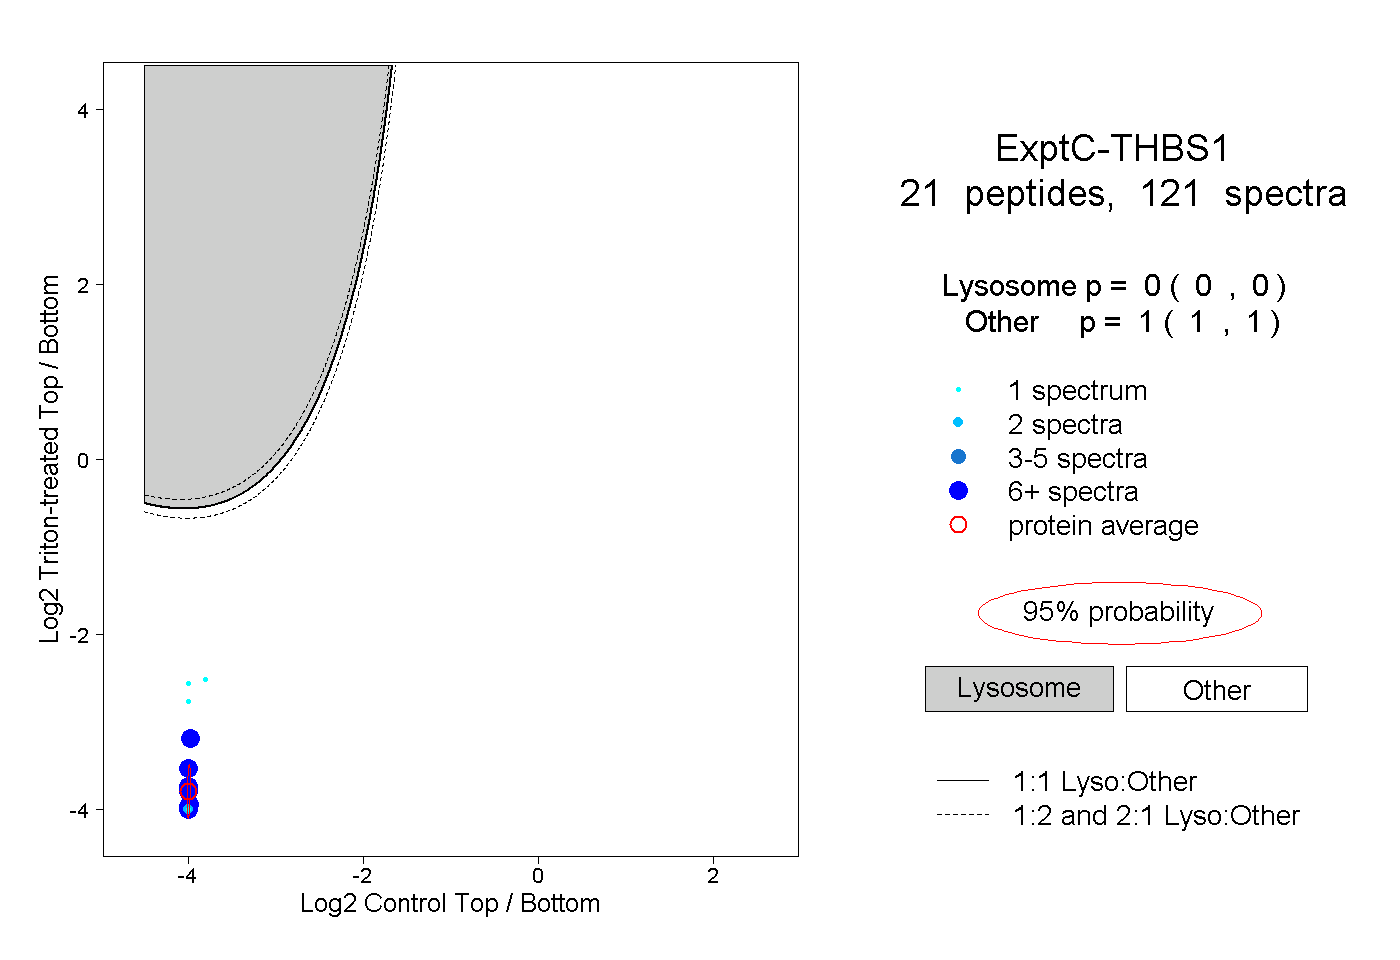 |
0.000 0.000 | 0.000 |
1.000 1.000 | 1.000 |
||||||||
| Plot | Lyso | Other | |||||||||||
| Expt D |
6 peptides |
11 spectra |
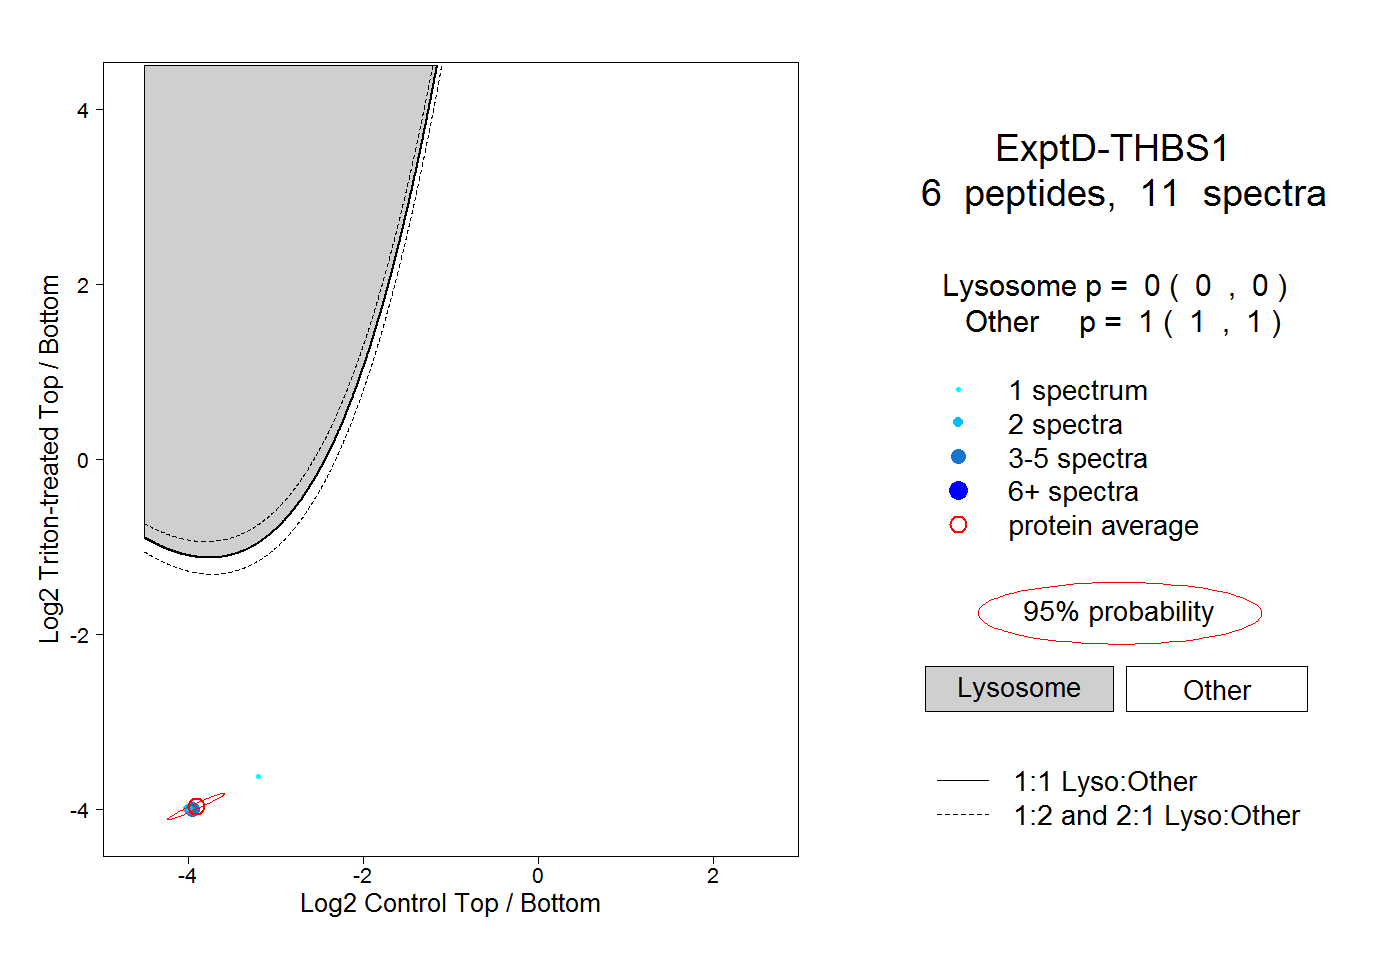 |
0.000 0.000 | 0.000 |
1.000 1.000 | 1.000 |