 1
1peptide
spectra
0.000 | 0.167
0.000 | 0.000
0.000 | 0.084
0.057 | 0.243
0.000 | 0.031
0.136 | 0.309
0.229 | 0.300
0.166 | 0.261
1peptide
spectra
0.000 | 0.000
1.000 | 1.000
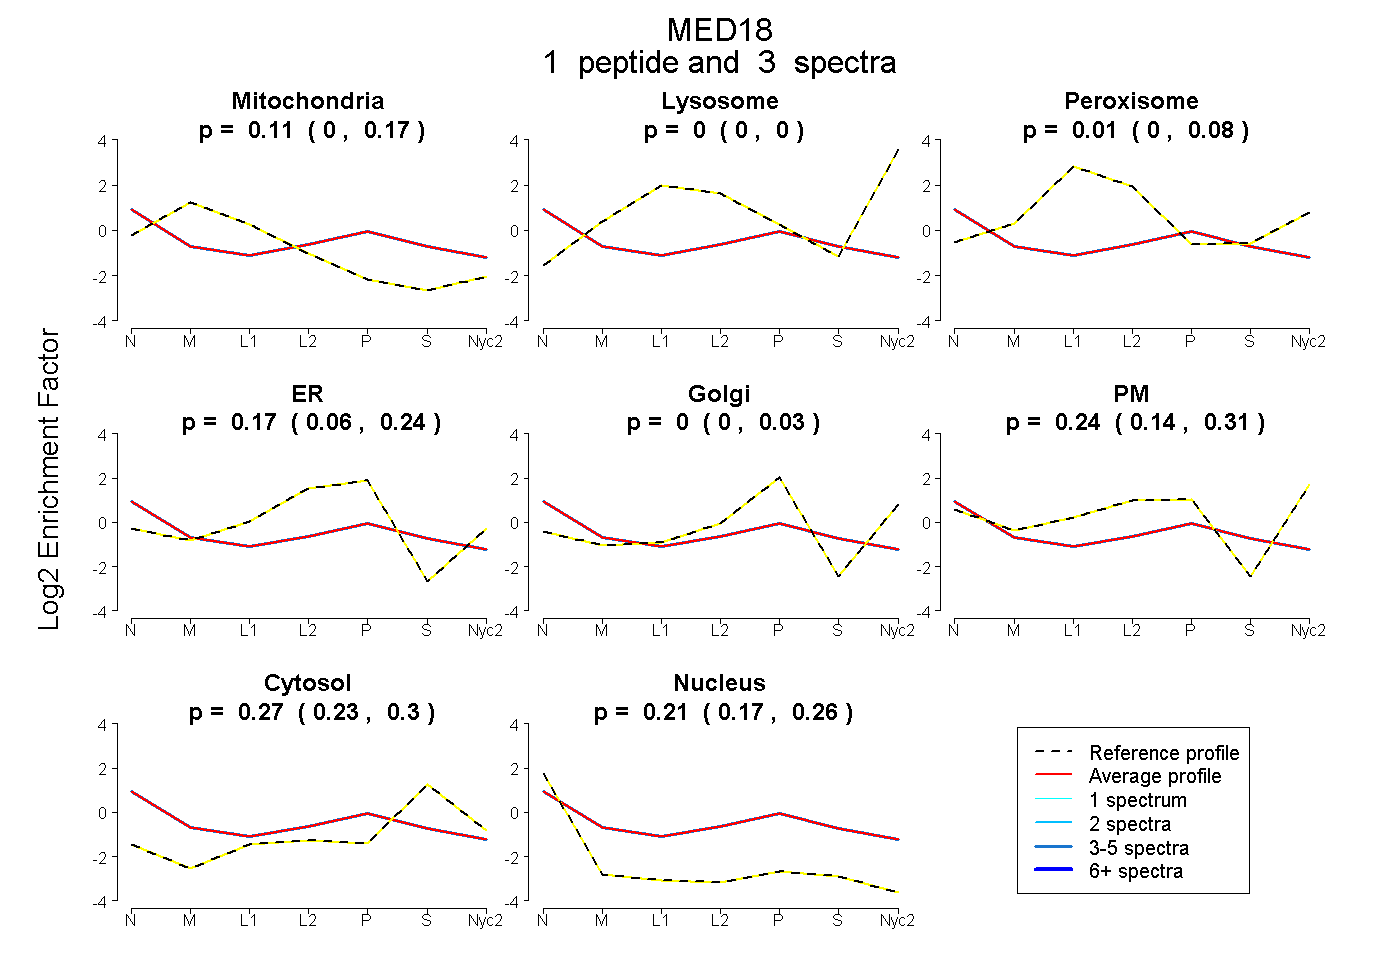
| Plot | Mito | Lyso | Perox | ER | Golgi | PM | Cytosol | Nucleus | |||||
| Expt A |
1 peptide |
3 spectra |
|
0.108 0.000 | 0.167 |
0.000 0.000 | 0.000 |
0.006 0.000 | 0.084 |
0.166 0.057 | 0.243 |
0.000 0.000 | 0.031 |
0.241 0.136 | 0.309 |
0.273 0.229 | 0.300 |
0.205 0.166 | 0.261 |
||
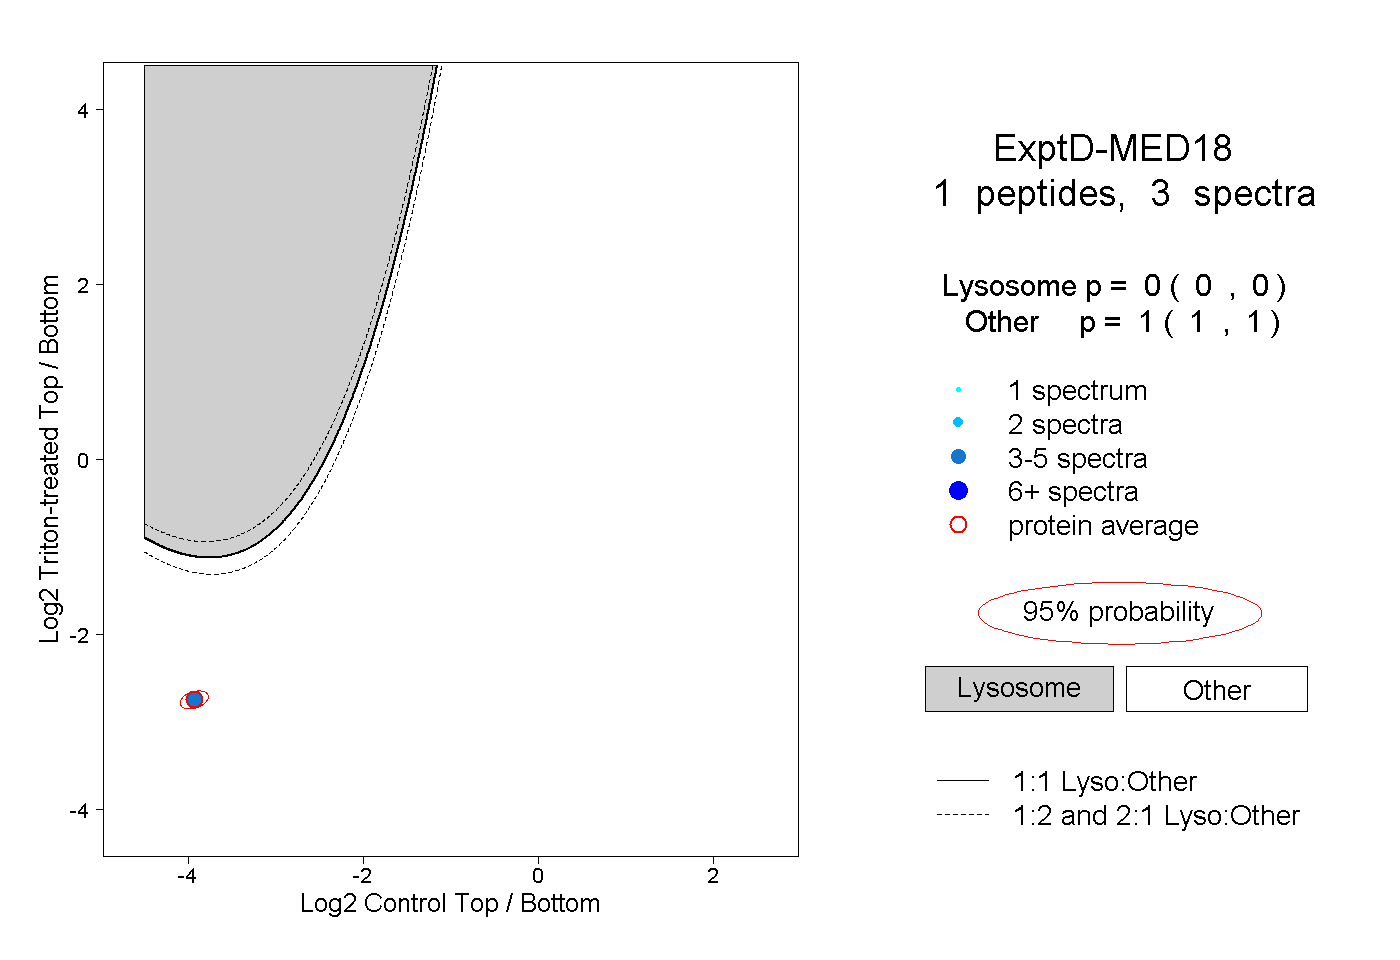
| Plot | Lyso | Other | |||||||||||
| Expt D |
1 peptide |
3 spectra |
|
0.000 0.000 | 0.000 |
1.000 1.000 | 1.000 |