 22
22peptides
spectra
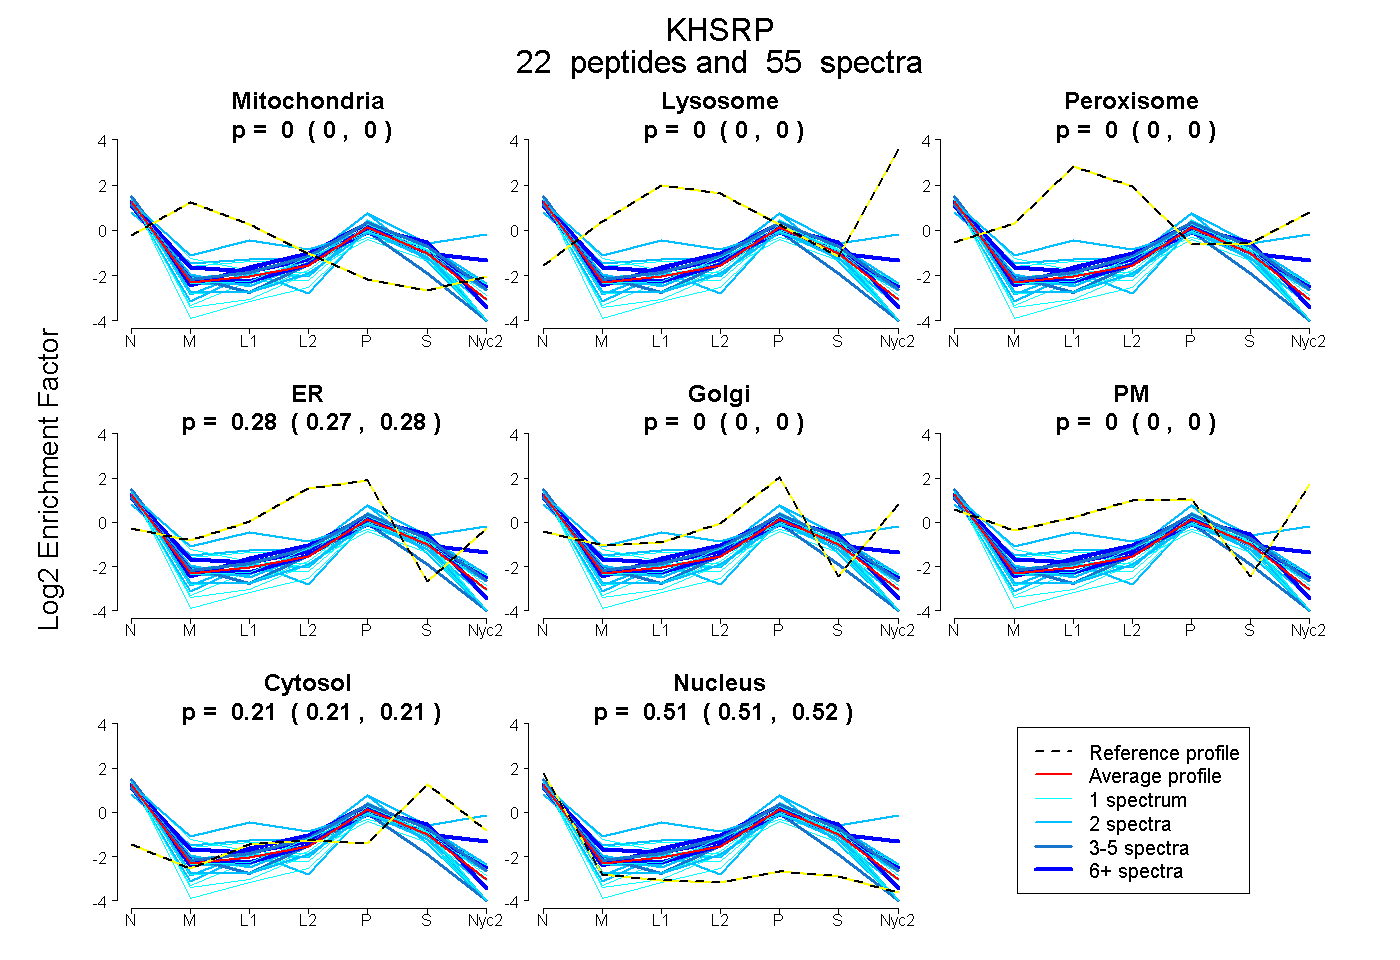
0.000 | 0.000
0.000 | 0.000
0.000 | 0.000
0.273 | 0.281
0.000 | 0.000
0.000 | 0.000
0.205 | 0.214
0.508 | 0.517
| Plot | Mito | Lyso | Perox | ER | Golgi | PM | Cytosol | Nucleus | |||||
| Expt A |
22 peptides |
55 spectra |
|
0.000 0.000 | 0.000 |
0.000 0.000 | 0.000 |
0.000 0.000 | 0.000 |
0.277 0.273 | 0.281 |
0.000 0.000 | 0.000 |
0.000 0.000 | 0.000 |
0.210 0.205 | 0.214 |
0.513 0.508 | 0.517 |
| 1 spectrum, VQQACEMVMDILR | 0.000 | 0.000 | 0.000 | 0.248 | 0.000 | 0.000 | 0.182 | 0.570 | ||
| 2 spectra, IAHIMGPPDR | 0.000 | 0.000 | 0.000 | 0.000 | 0.397 | 0.146 | 0.305 | 0.152 | ||
| 6 spectra, SGEMIK | 0.000 | 0.000 | 0.000 | 0.230 | 0.000 | 0.000 | 0.280 | 0.490 | ||
| 3 spectra, IINDLLQSLR | 0.000 | 0.000 | 0.000 | 0.301 | 0.000 | 0.000 | 0.000 | 0.699 | ||
| 1 spectrum, GGETLK | 0.000 | 0.000 | 0.000 | 0.241 | 0.000 | 0.000 | 0.201 | 0.558 | ||
| 1 spectrum, SVSLTGAPESVQK | 0.000 | 0.000 | 0.000 | 0.100 | 0.000 | 0.000 | 0.250 | 0.650 | ||
| 2 spectra, LASQGDSIGSQLGPIHPPPR | 0.081 | 0.000 | 0.140 | 0.292 | 0.000 | 0.000 | 0.042 | 0.445 | ||
| 2 spectra, VQISPDSGGLPER | 0.000 | 0.000 | 0.000 | 0.159 | 0.000 | 0.000 | 0.193 | 0.648 | ||
| 2 spectra, AWEEYYK | 0.000 | 0.000 | 0.000 | 0.009 | 0.239 | 0.000 | 0.299 | 0.453 | ||
| 1 spectrum, MMLDDIVSR | 0.000 | 0.000 | 0.000 | 0.307 | 0.000 | 0.000 | 0.259 | 0.434 | ||
| 1 spectrum, AINQQTGAFVEISR | 0.000 | 0.000 | 0.000 | 0.152 | 0.000 | 0.000 | 0.194 | 0.654 | ||
| 1 spectrum, GGENVK | 0.000 | 0.000 | 0.000 | 0.287 | 0.000 | 0.000 | 0.167 | 0.546 | ||
| 10 spectra, IQNDAGVR | 0.000 | 0.000 | 0.000 | 0.144 | 0.243 | 0.038 | 0.233 | 0.342 | ||
| 1 spectrum, GGEQINK | 0.000 | 0.000 | 0.063 | 0.266 | 0.000 | 0.000 | 0.201 | 0.471 | ||
| 1 spectrum, VPDGMVGLIIGR | 0.000 | 0.000 | 0.000 | 0.086 | 0.154 | 0.000 | 0.235 | 0.525 | ||
| 1 spectrum, IIGDPYK | 0.116 | 0.000 | 0.000 | 0.215 | 0.000 | 0.000 | 0.088 | 0.581 | ||
| 2 spectra, DAFADAVQR | 0.000 | 0.000 | 0.000 | 0.165 | 0.000 | 0.000 | 0.168 | 0.667 | ||
| 1 spectrum, GSPQQIDHAK | 0.000 | 0.000 | 0.000 | 0.038 | 0.045 | 0.000 | 0.183 | 0.735 | ||
| 5 spectra, TSMTEEYR | 0.000 | 0.000 | 0.000 | 0.324 | 0.000 | 0.000 | 0.267 | 0.409 | ||
| 2 spectra, QDDGTGPEK | 0.000 | 0.000 | 0.000 | 0.214 | 0.126 | 0.000 | 0.178 | 0.481 | ||
| 7 spectra, IQQDSGCK | 0.000 | 0.000 | 0.000 | 0.320 | 0.000 | 0.000 | 0.238 | 0.441 | ||
| 2 spectra, CGLVIGR | 0.000 | 0.000 | 0.000 | 0.344 | 0.000 | 0.000 | 0.074 | 0.582 |
| Plot | Mito | Lyso or Perox | ER | Golgi | PM | Cytosol | Nucleus | ||||||
| Expt B |
7 peptides |
10 spectra |
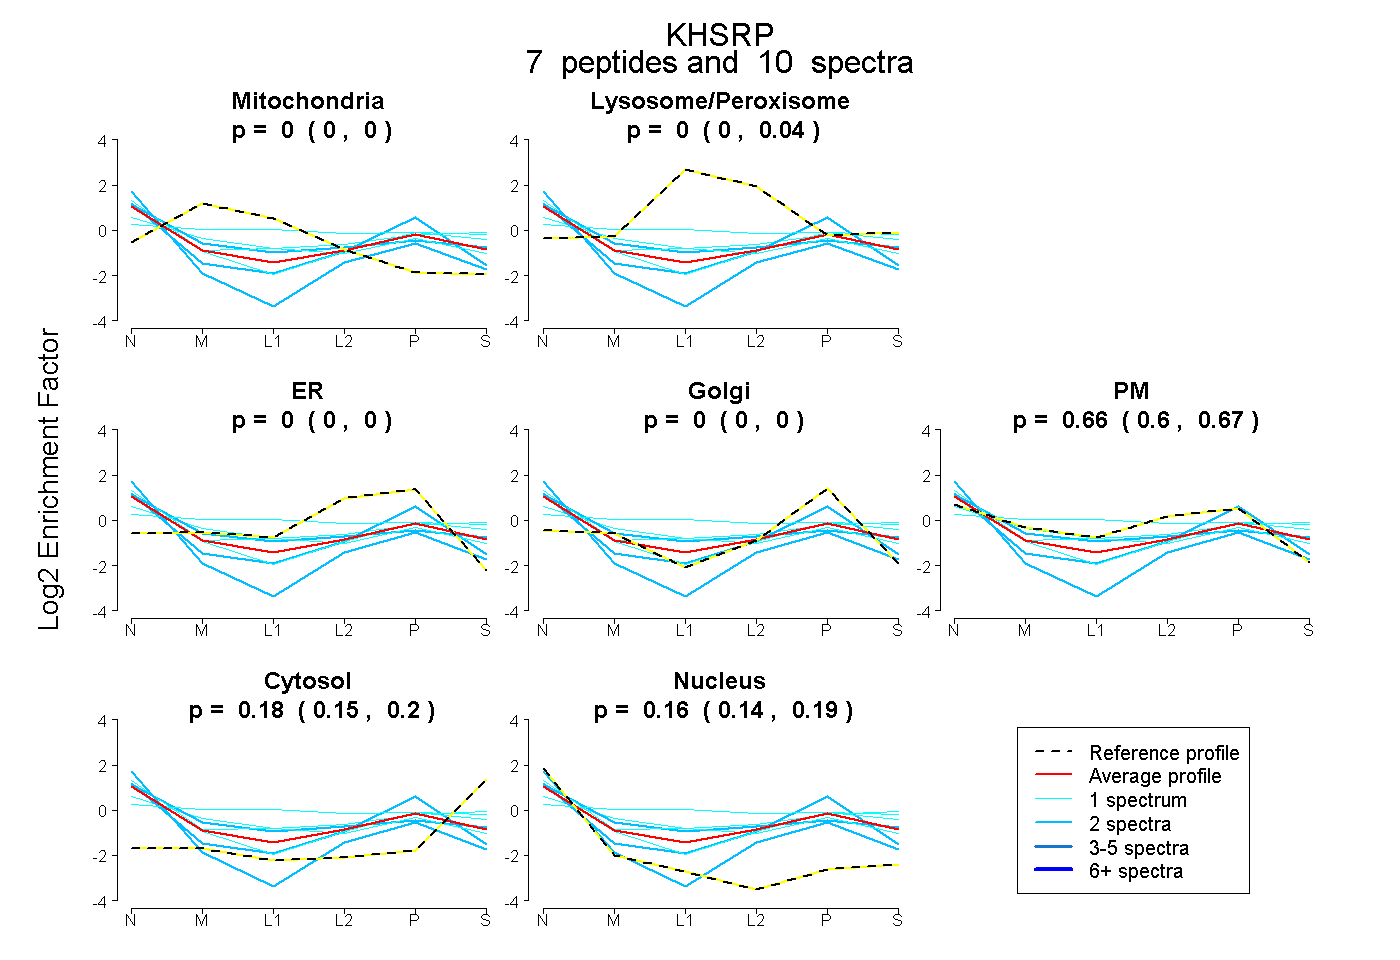 |
0.000 0.000 | 0.000 |
0.000 0.000 | 0.045 |
0.000 0.000 | 0.000 |
0.000 0.000 | 0.000 |
0.658 0.596 | 0.673 |
0.181 0.146 | 0.203 |
0.161 0.140 | 0.189 |
|||
| Plot | Lyso | Other | |||||||||||
| Expt C |
11 peptides |
23 spectra |
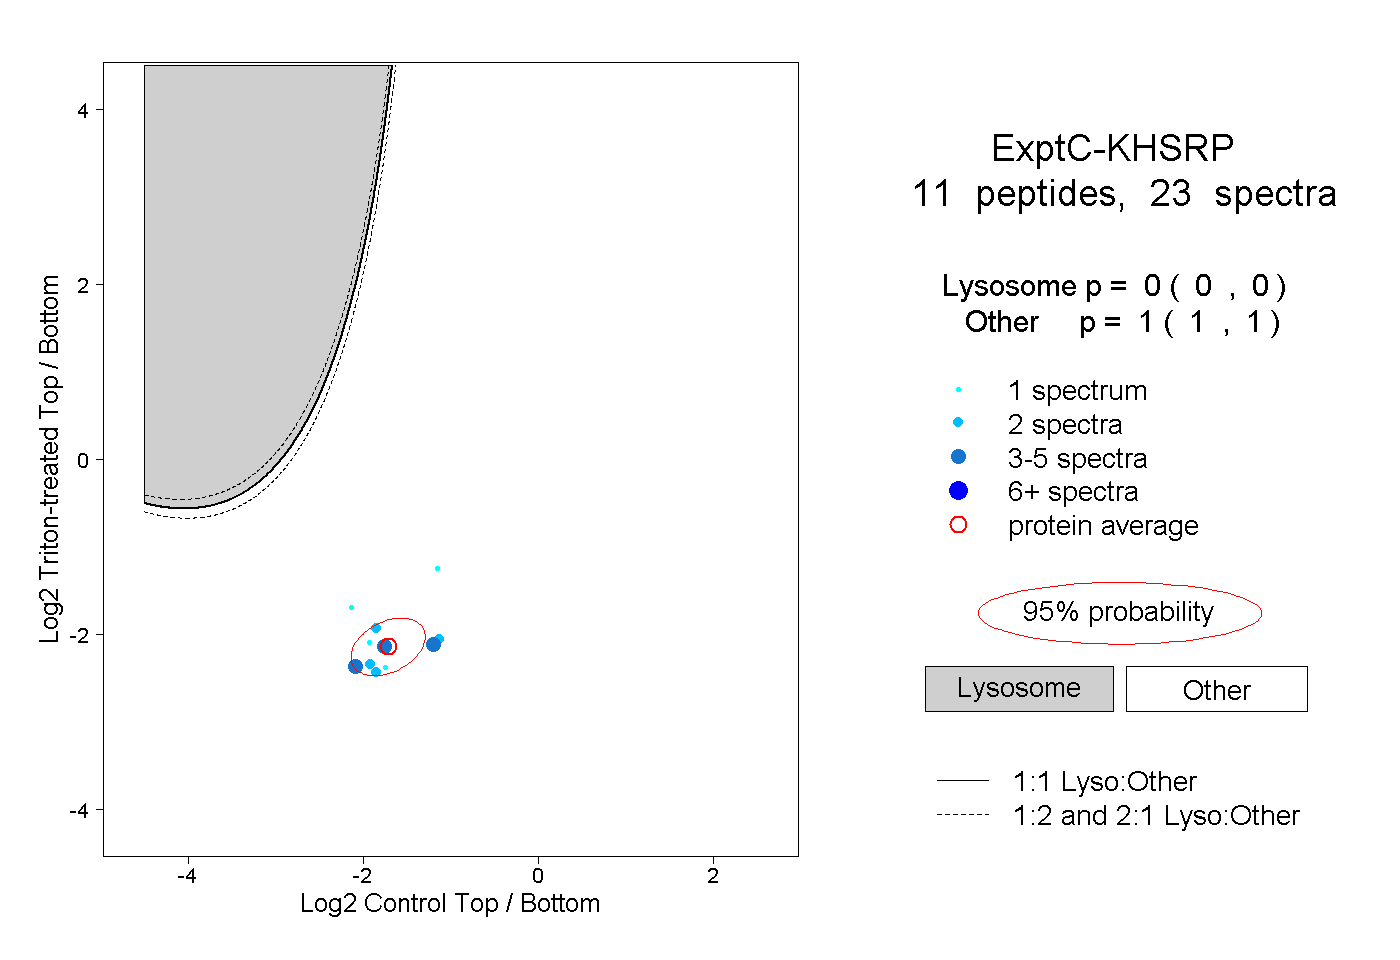 |
0.000 0.000 | 0.000 |
1.000 1.000 | 1.000 |
||||||||
| Plot | Lyso | Other | |||||||||||
| Expt D |
3 peptides |
5 spectra |
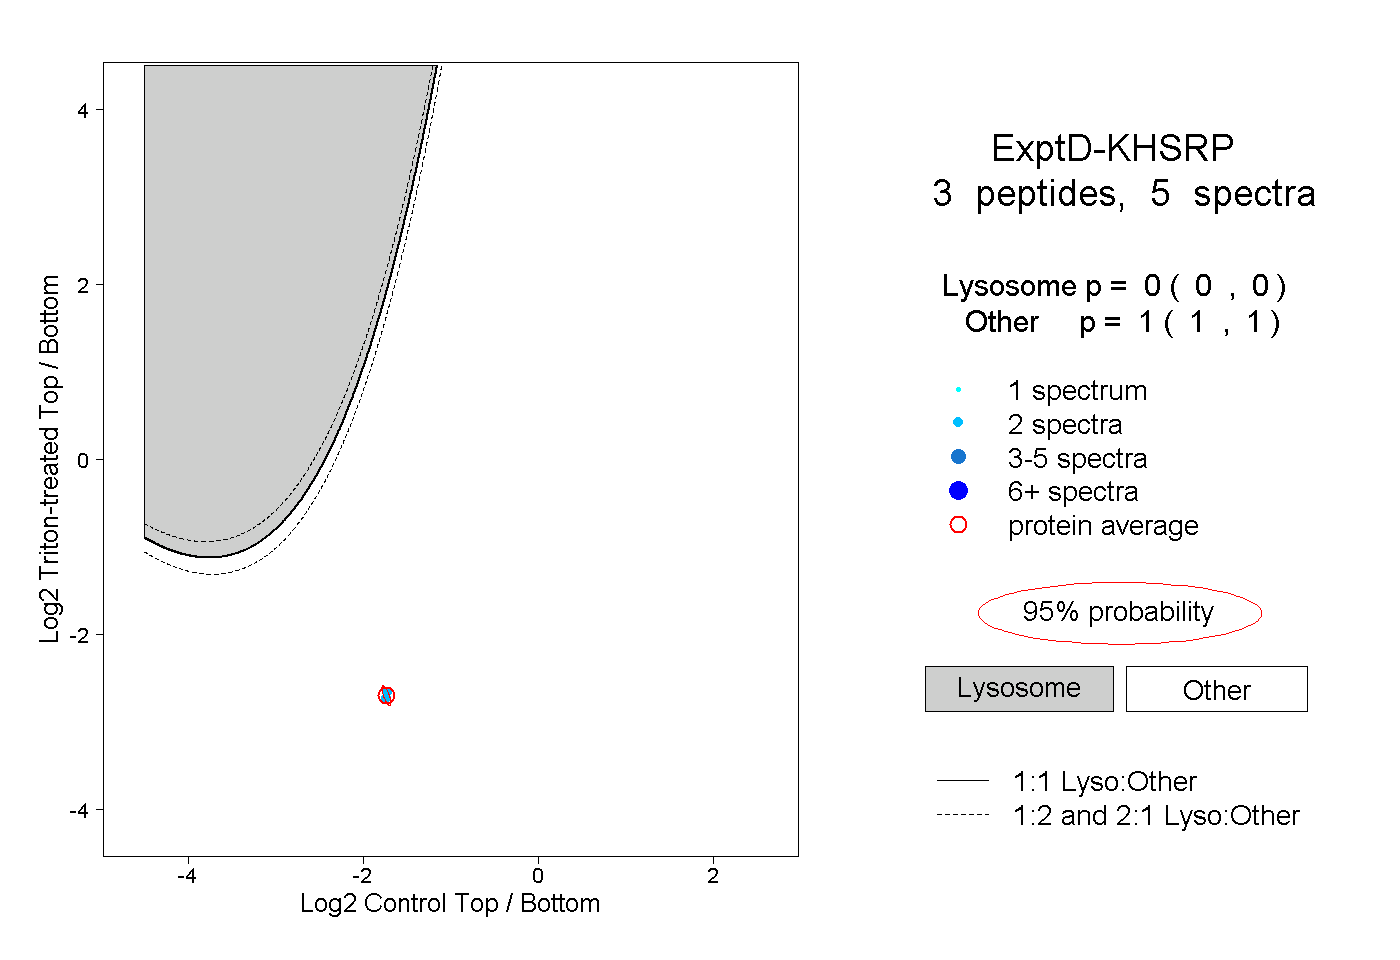 |
0.000 0.000 | 0.000 |
1.000 1.000 | 1.000 |