 5
5peptides
spectra
0.821 | 0.904
0.000 | 0.000
0.000 | 0.000
0.000 | 0.000
0.000 | 0.000
0.000 | 0.000
0.000 | 0.077
0.057 | 0.142
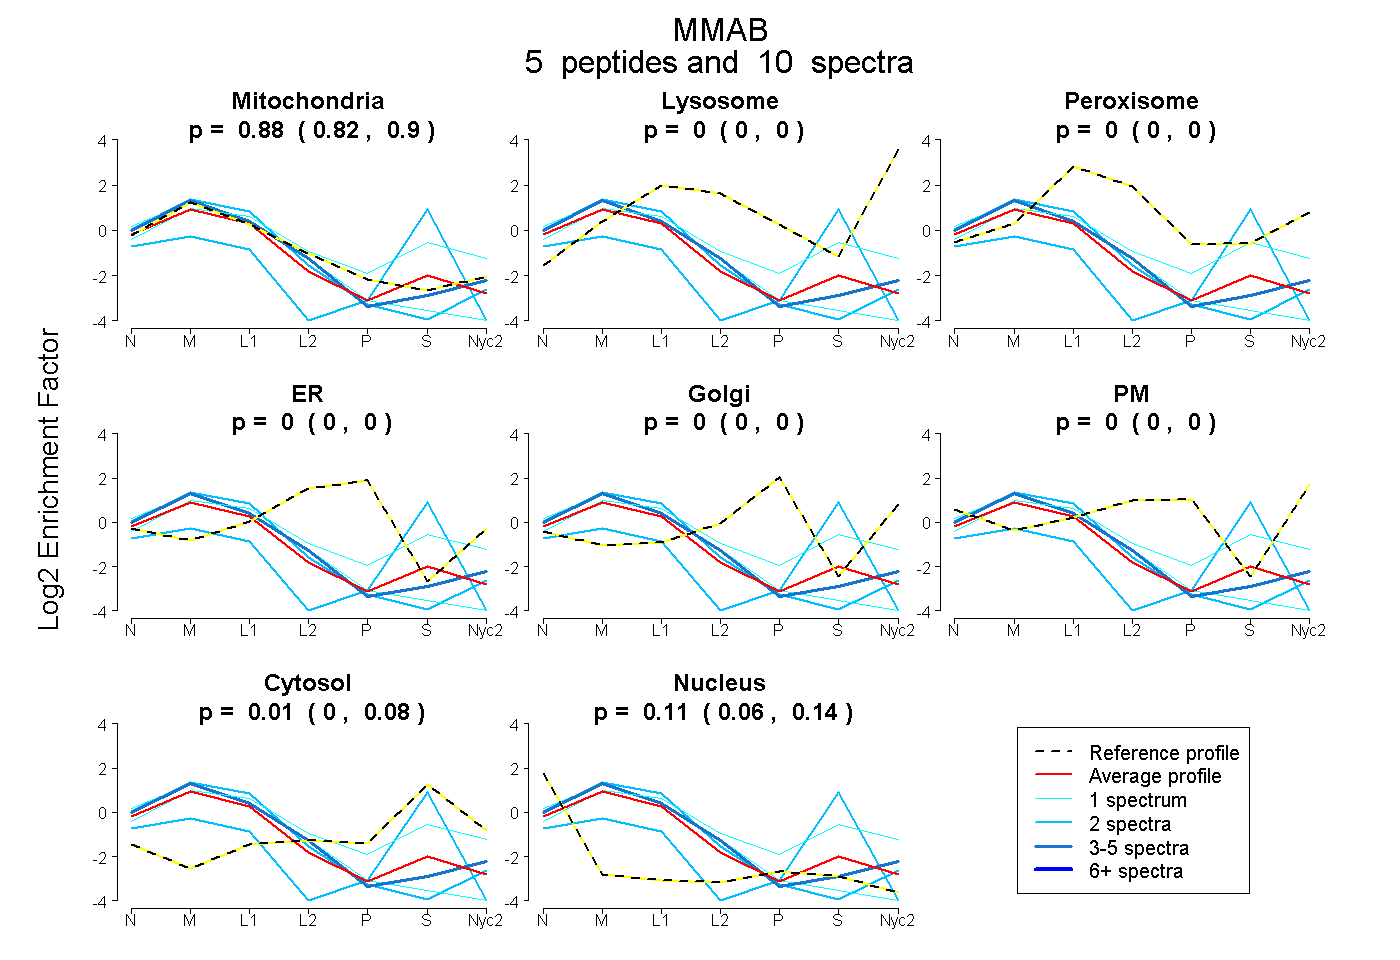
| Plot | Mito | Lyso | Perox | ER | Golgi | PM | Cytosol | Nucleus | |||||
| Expt A |
5 peptides |
10 spectra |
|
0.876 0.821 | 0.904 |
0.000 0.000 | 0.000 |
0.000 0.000 | 0.000 |
0.000 0.000 | 0.000 |
0.000 0.000 | 0.000 |
0.000 0.000 | 0.000 |
0.013 0.000 | 0.077 |
0.111 0.057 | 0.142 |
| 2 spectra, GLSSTFTGER | 0.971 | 0.000 | 0.000 | 0.000 | 0.000 | 0.000 | 0.000 | 0.029 | ||
| 4 spectra, LSDYLFTVAR | 0.970 | 0.000 | 0.000 | 0.000 | 0.000 | 0.000 | 0.000 | 0.030 | ||
| 1 spectrum, IQCTLQDVGSALATPR | 0.885 | 0.000 | 0.000 | 0.000 | 0.000 | 0.000 | 0.000 | 0.115 | ||
| 1 spectrum, VVPLVQMGETDANVAK | 0.591 | 0.000 | 0.194 | 0.000 | 0.000 | 0.000 | 0.215 | 0.000 | ||
| 2 spectra, GHTFAEELR | 0.290 | 0.000 | 0.000 | 0.000 | 0.000 | 0.000 | 0.423 | 0.288 |
| Plot | Mito | Lyso or Perox | ER | Golgi | PM | Cytosol | Nucleus | ||||||
| Expt B |
3 peptides |
7 spectra |
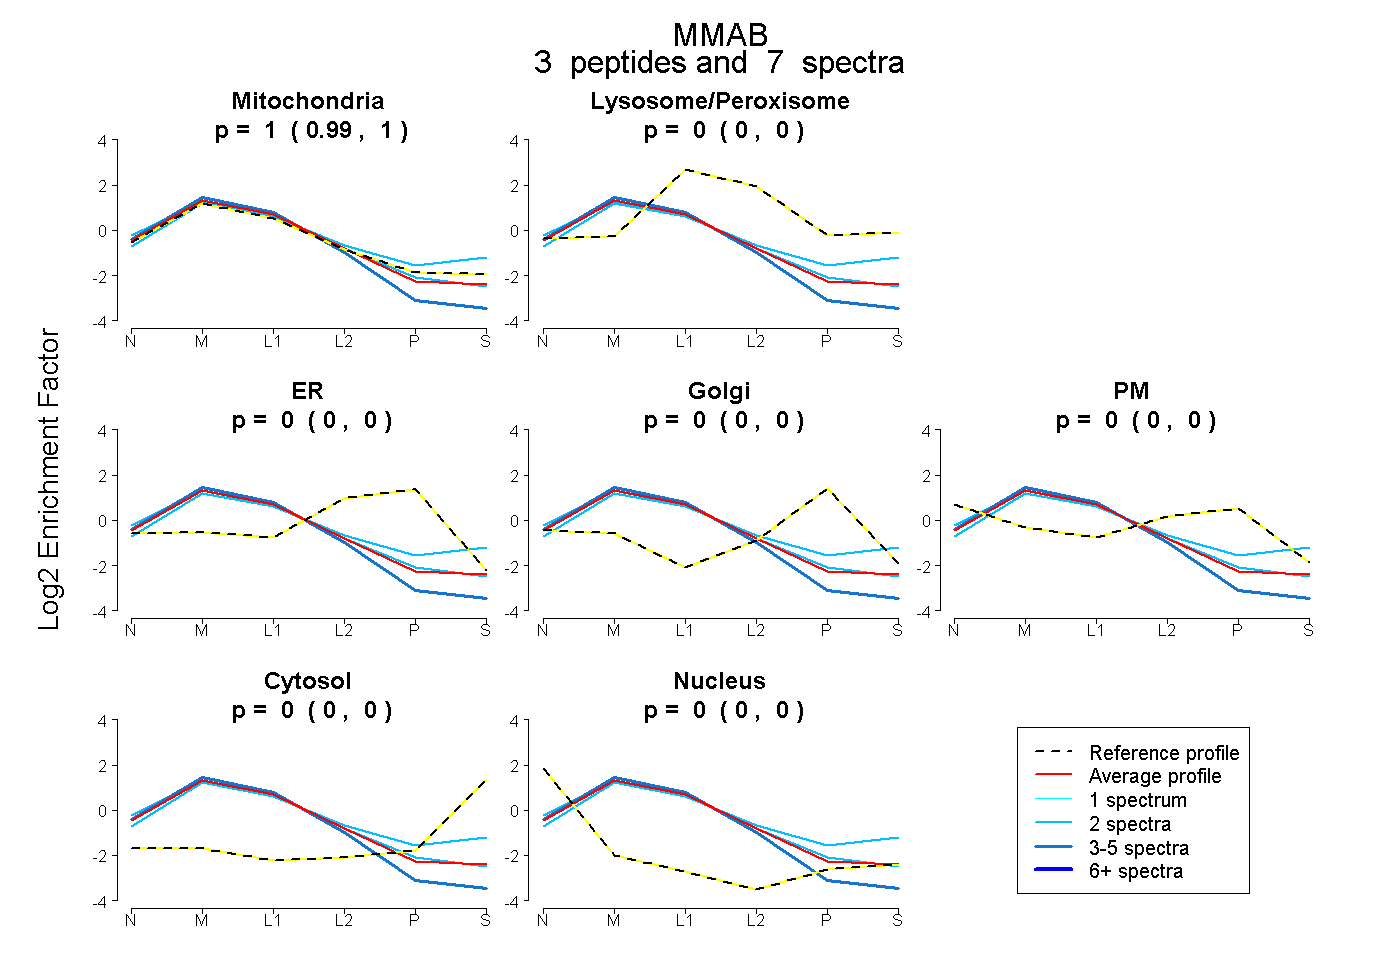 |
1.000 0.993 | 1.000 |
0.000 0.000 | 0.000 |
0.000 0.000 | 0.000 |
0.000 0.000 | 0.000 |
0.000 0.000 | 0.000 |
0.000 0.000 | 0.000 |
0.000 0.000 | 0.005 |
|||
| Plot | Lyso | Other | |||||||||||
| Expt C |
7 peptides |
43 spectra |
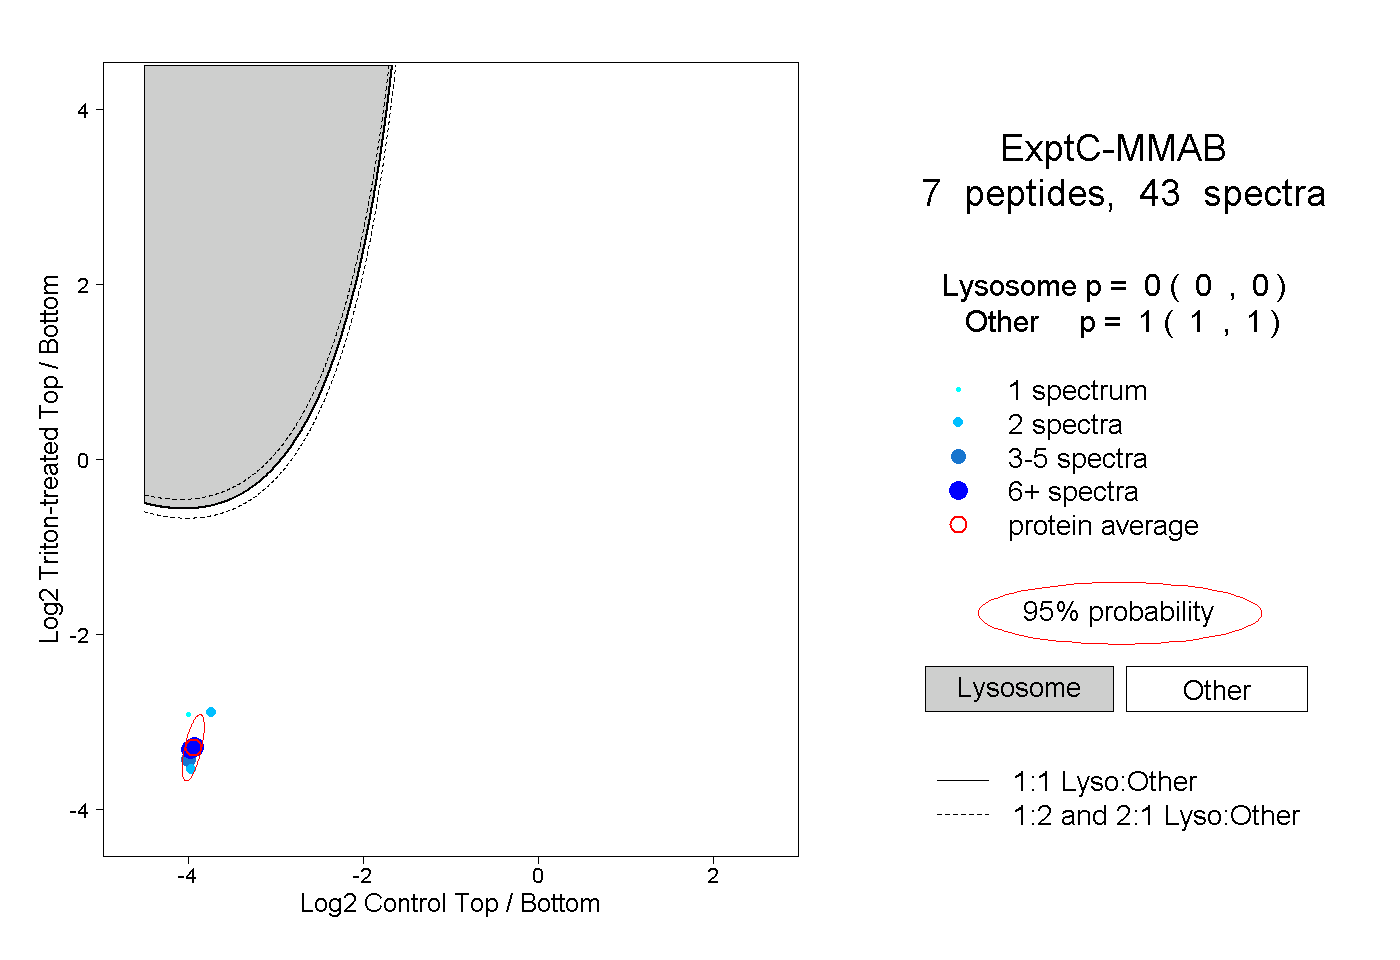 |
0.000 0.000 | 0.000 |
1.000 1.000 | 1.000 |
||||||||
| Plot | Lyso | Other | |||||||||||
| Expt D |
4 peptides |
7 spectra |
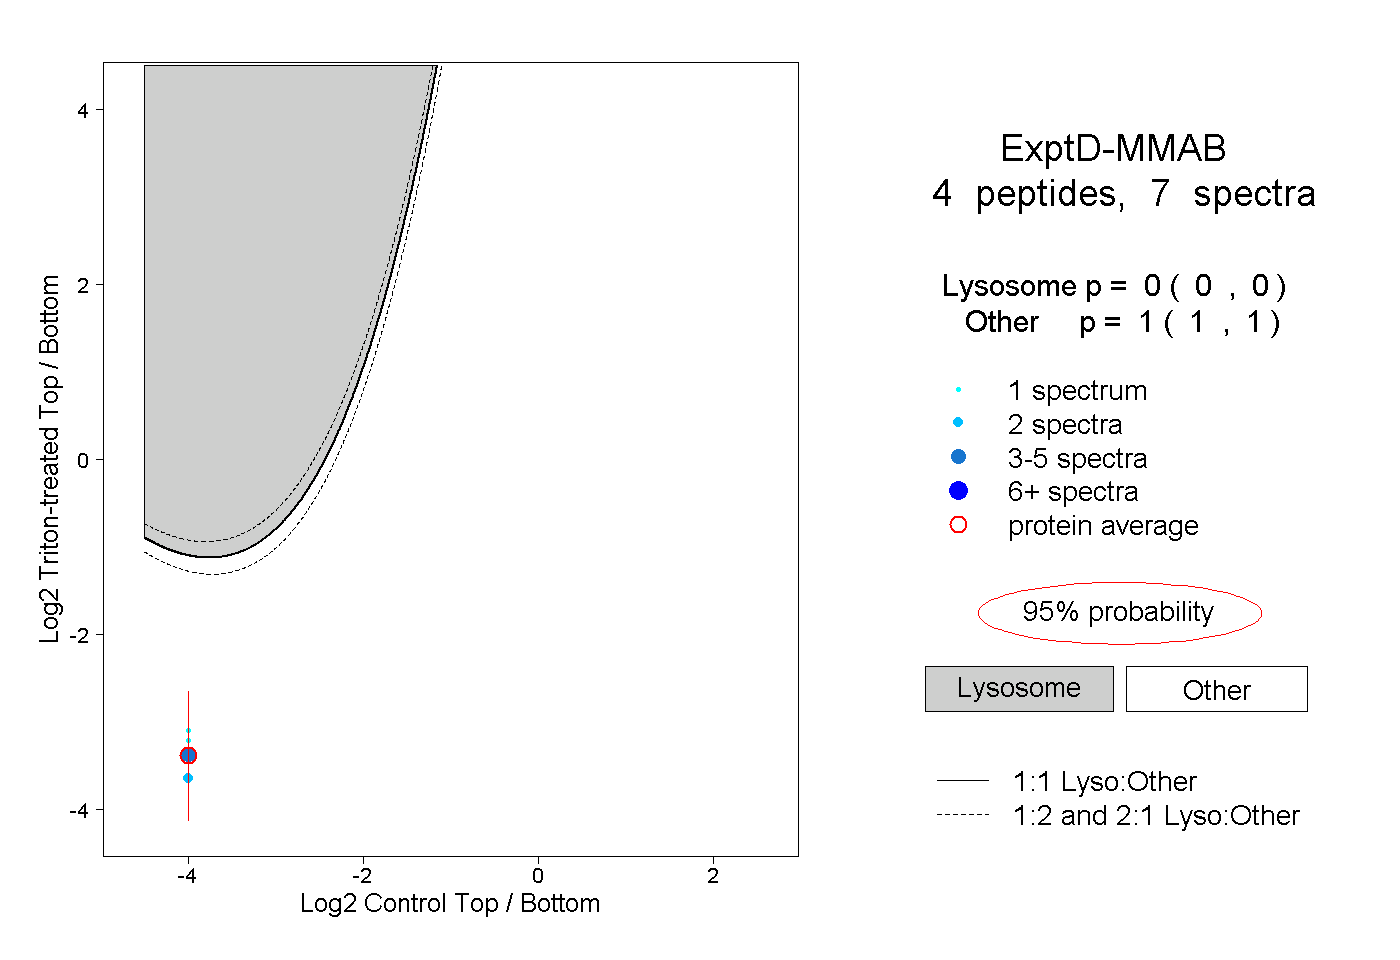 |
0.000 0.000 | 0.000 |
1.000 1.000 | 1.000 |