 34
34peptides
spectra
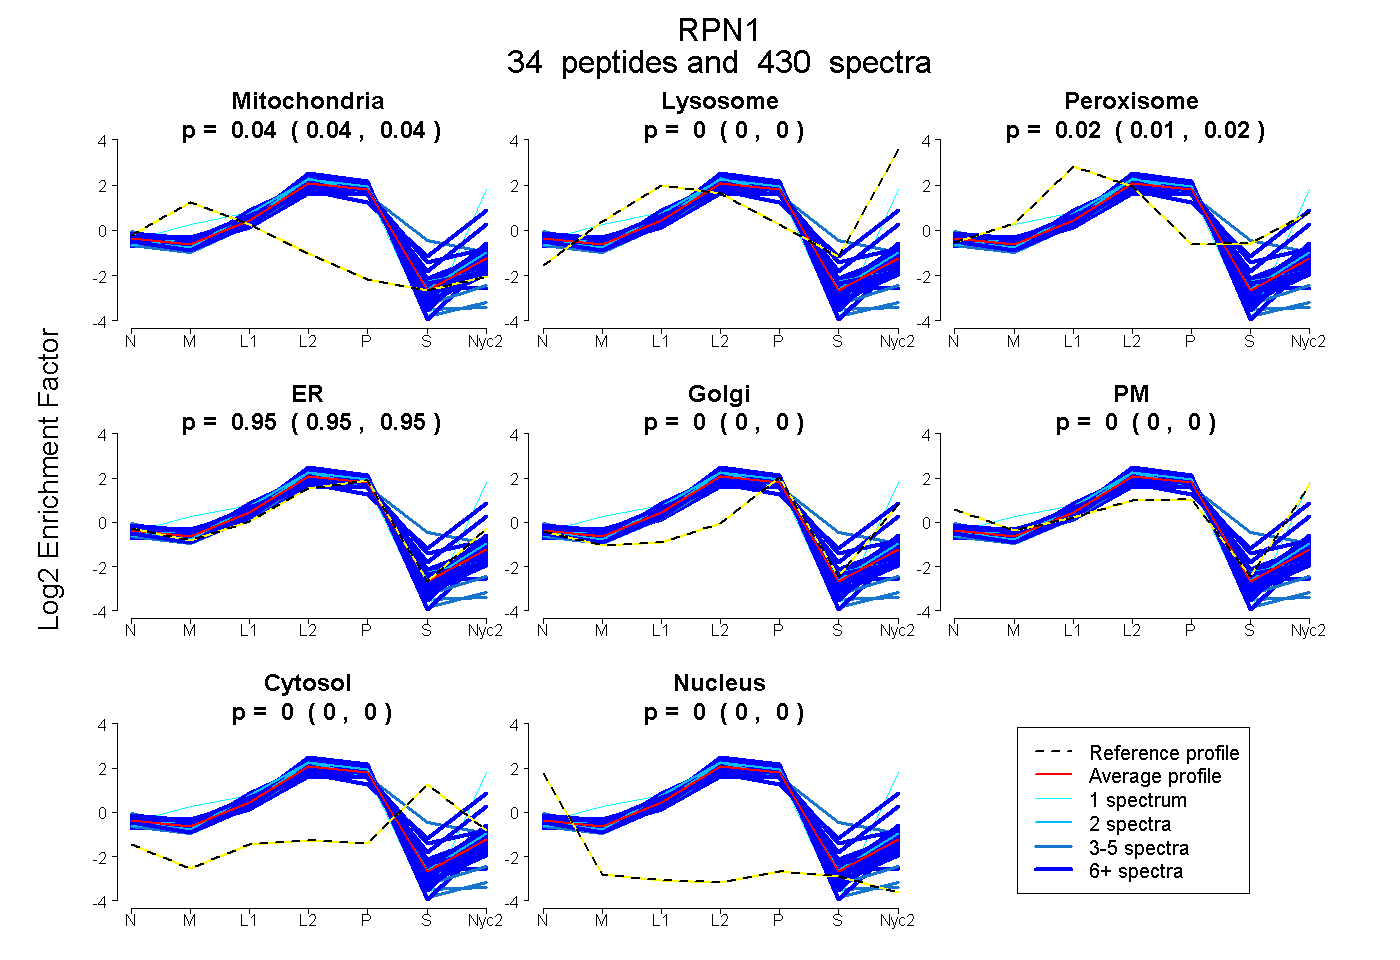
0.035 | 0.038
0.000 | 0.000
0.014 | 0.017
0.947 | 0.949
0.000 | 0.000
0.000 | 0.000
0.000 | 0.000
0.000 | 0.000
31peptides
spectra
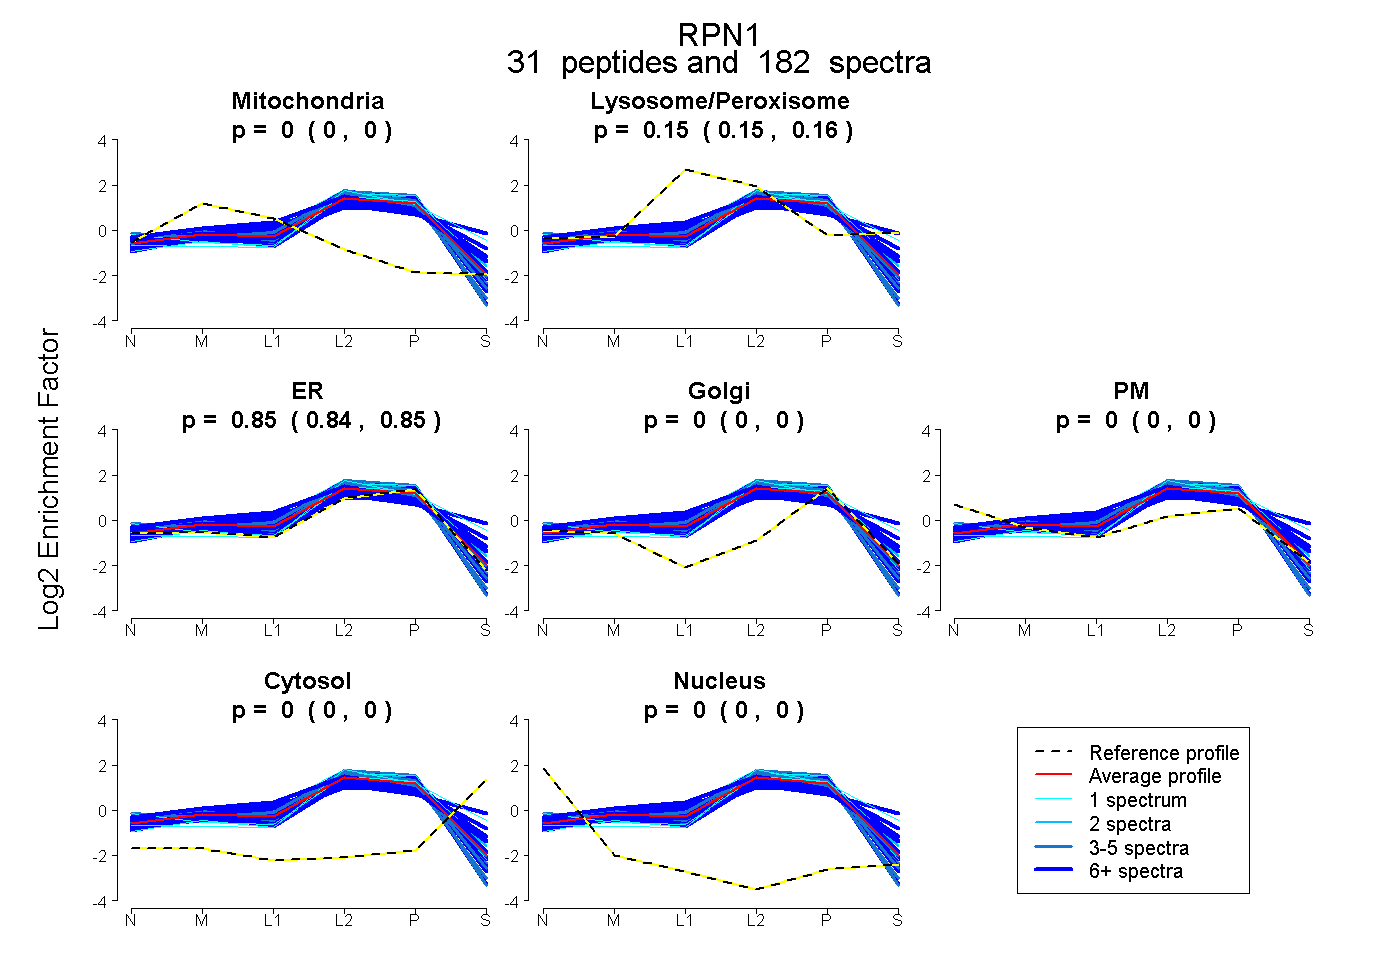
0.000 | 0.000
0.151 | 0.156
0.843 | 0.848
0.000 | 0.000
0.000 | 0.000
0.000 | 0.000
0.000 | 0.000
34peptides
spectra
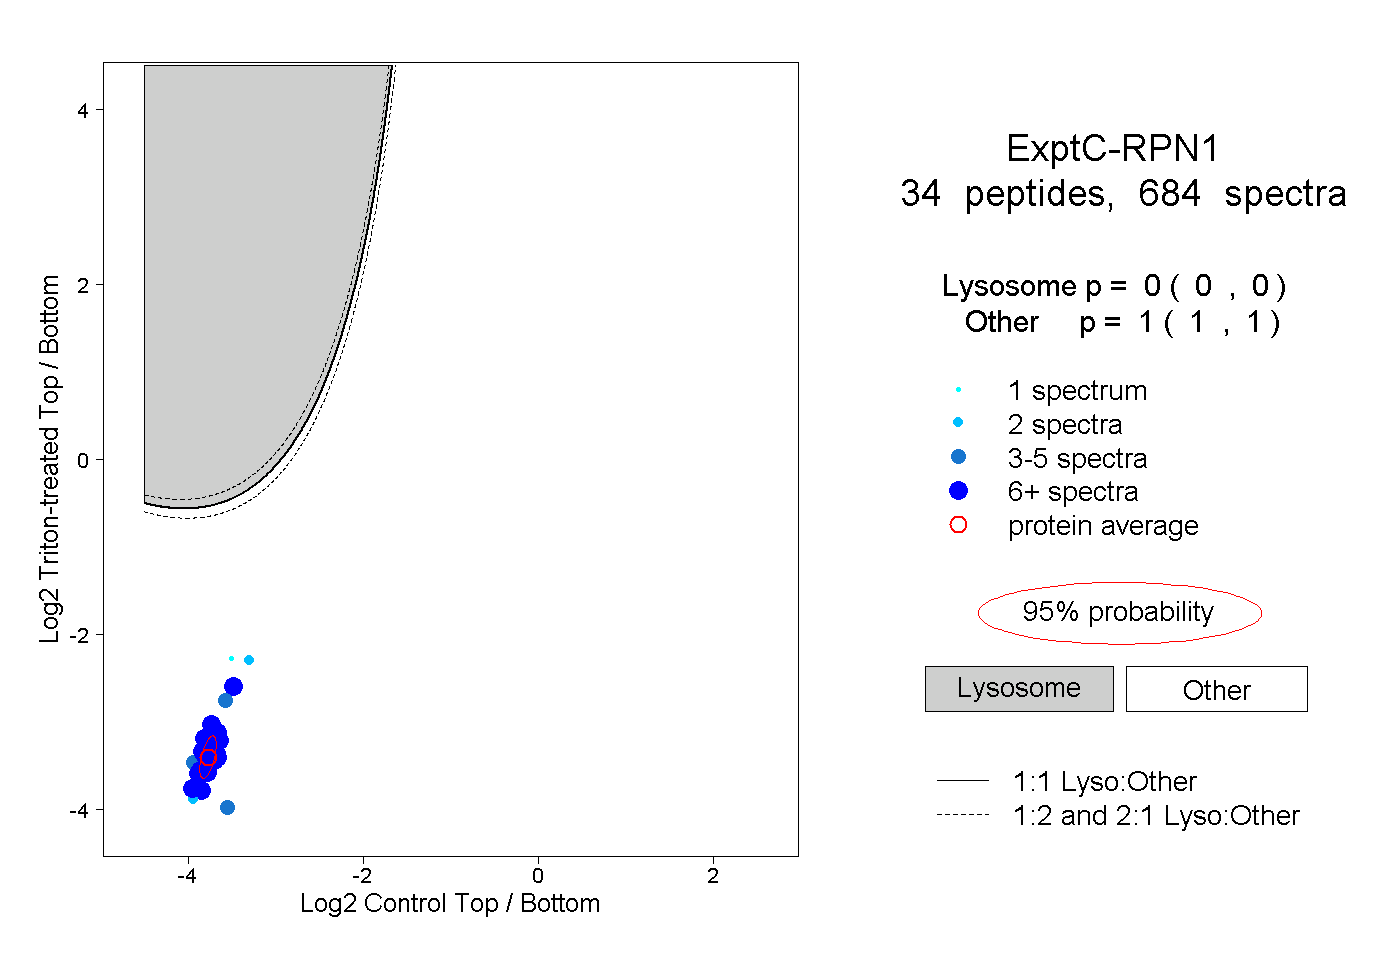
0.000 | 0.000
1.000 | 1.000
20peptides
spectra
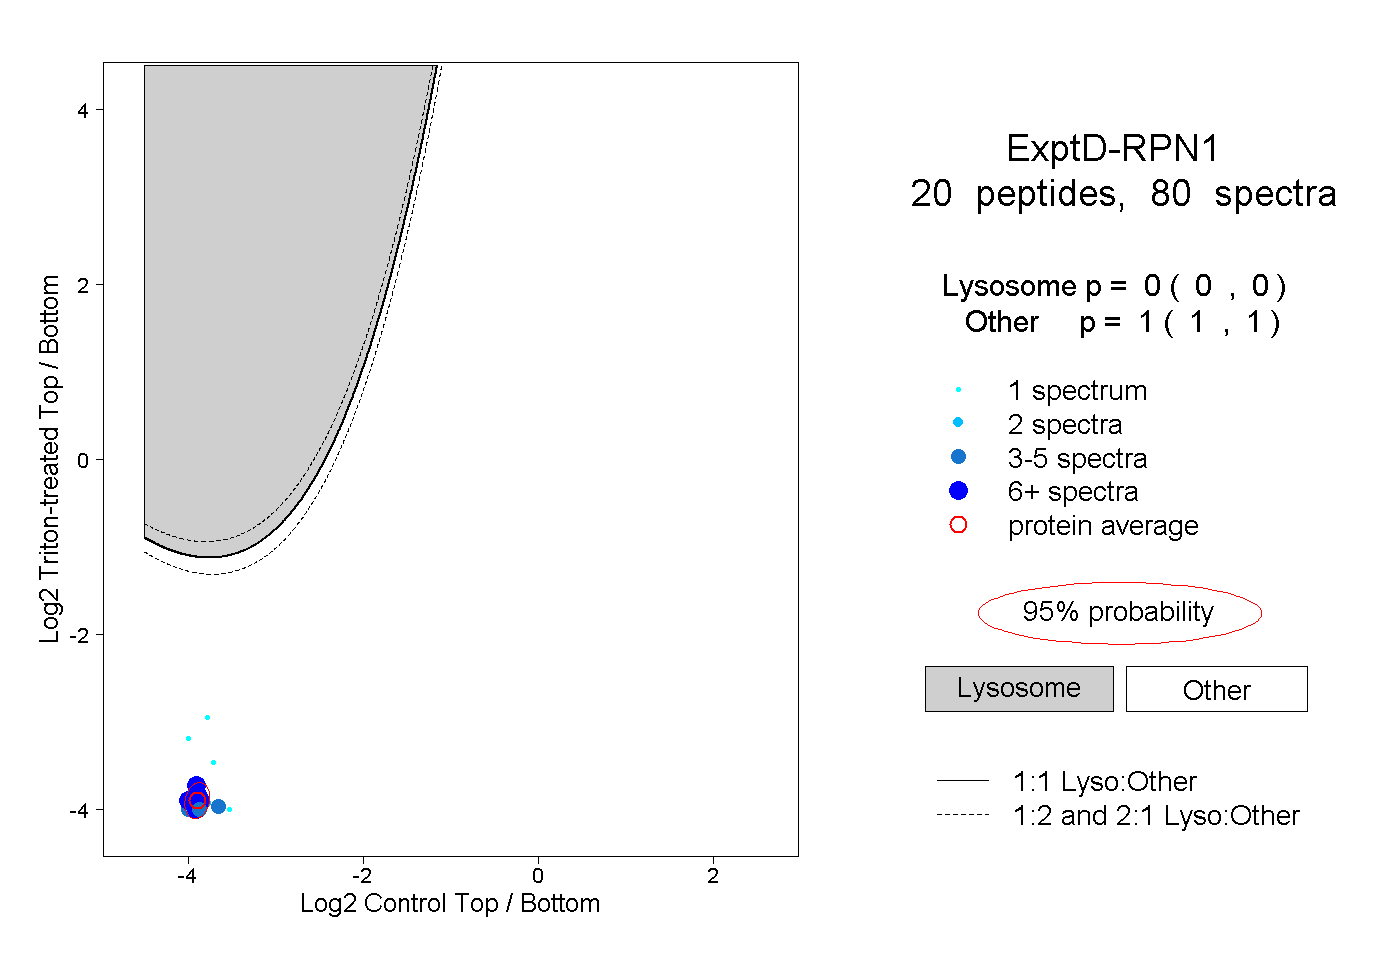
0.000 | 0.000
1.000 | 1.000