 1
1peptide
spectra
0.000 | 0.000
0.280 | 0.309
0.000 | 0.000
0.000 | 0.000
0.000 | 0.022
0.000 | 0.000
0.682 | 0.708
0.000 | 0.000
2peptides
spectra
0.000 | 0.001
0.999 | 1.000
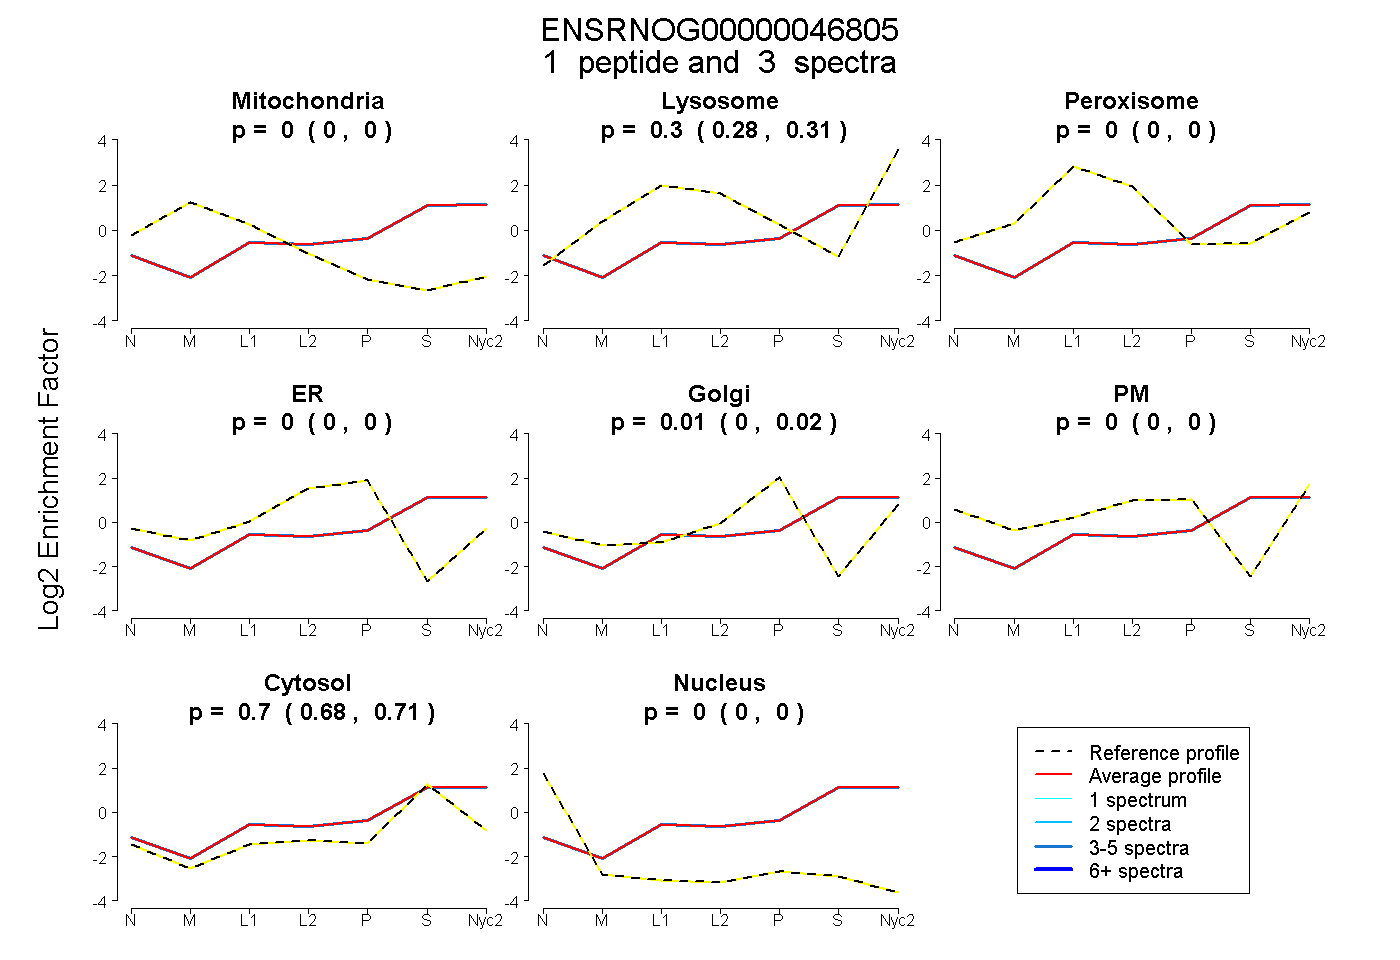
| Plot | Mito | Lyso | Perox | ER | Golgi | PM | Cytosol | Nucleus | |||||
| Expt A |
1 peptide |
3 spectra |
|
0.000 0.000 | 0.000 |
0.296 0.280 | 0.309 |
0.000 0.000 | 0.000 |
0.000 0.000 | 0.000 |
0.008 0.000 | 0.022 |
0.000 0.000 | 0.000 |
0.697 0.682 | 0.708 |
0.000 0.000 | 0.000 |
||
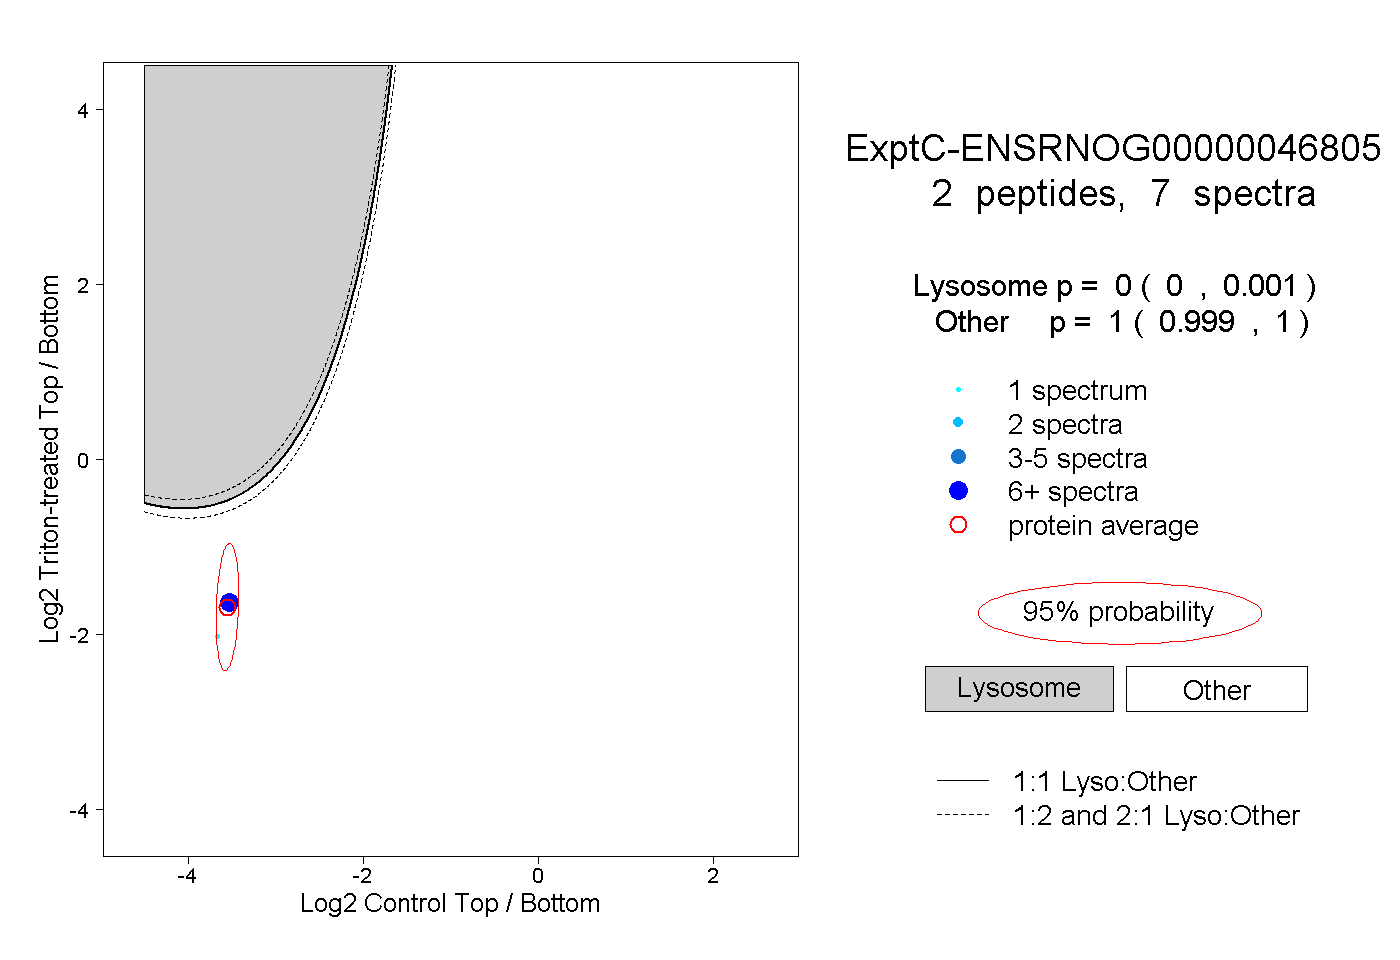
| Plot | Lyso | Other | |||||||||||
| Expt C |
2 peptides |
7 spectra |
|
0.000 0.000 | 0.001 |
1.000 0.999 | 1.000 |