 3
3peptides
spectra
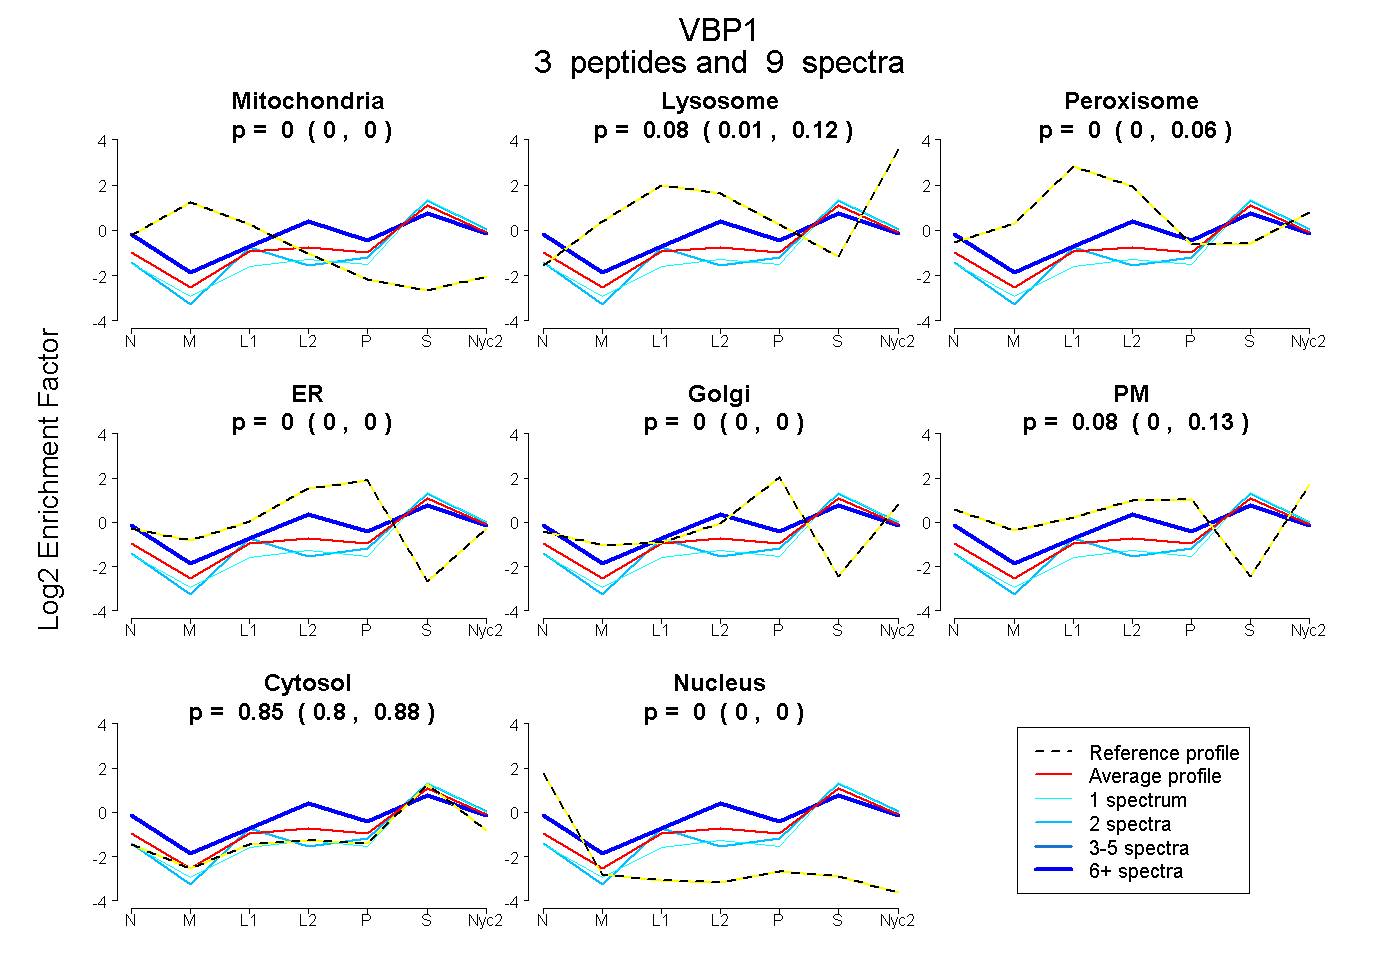
0.000 | 0.000
0.007 | 0.116
0.000 | 0.059
0.000 | 0.000
0.000 | 0.000
0.000 | 0.129
0.800 | 0.878
0.000 | 0.000
1peptide
spectrum
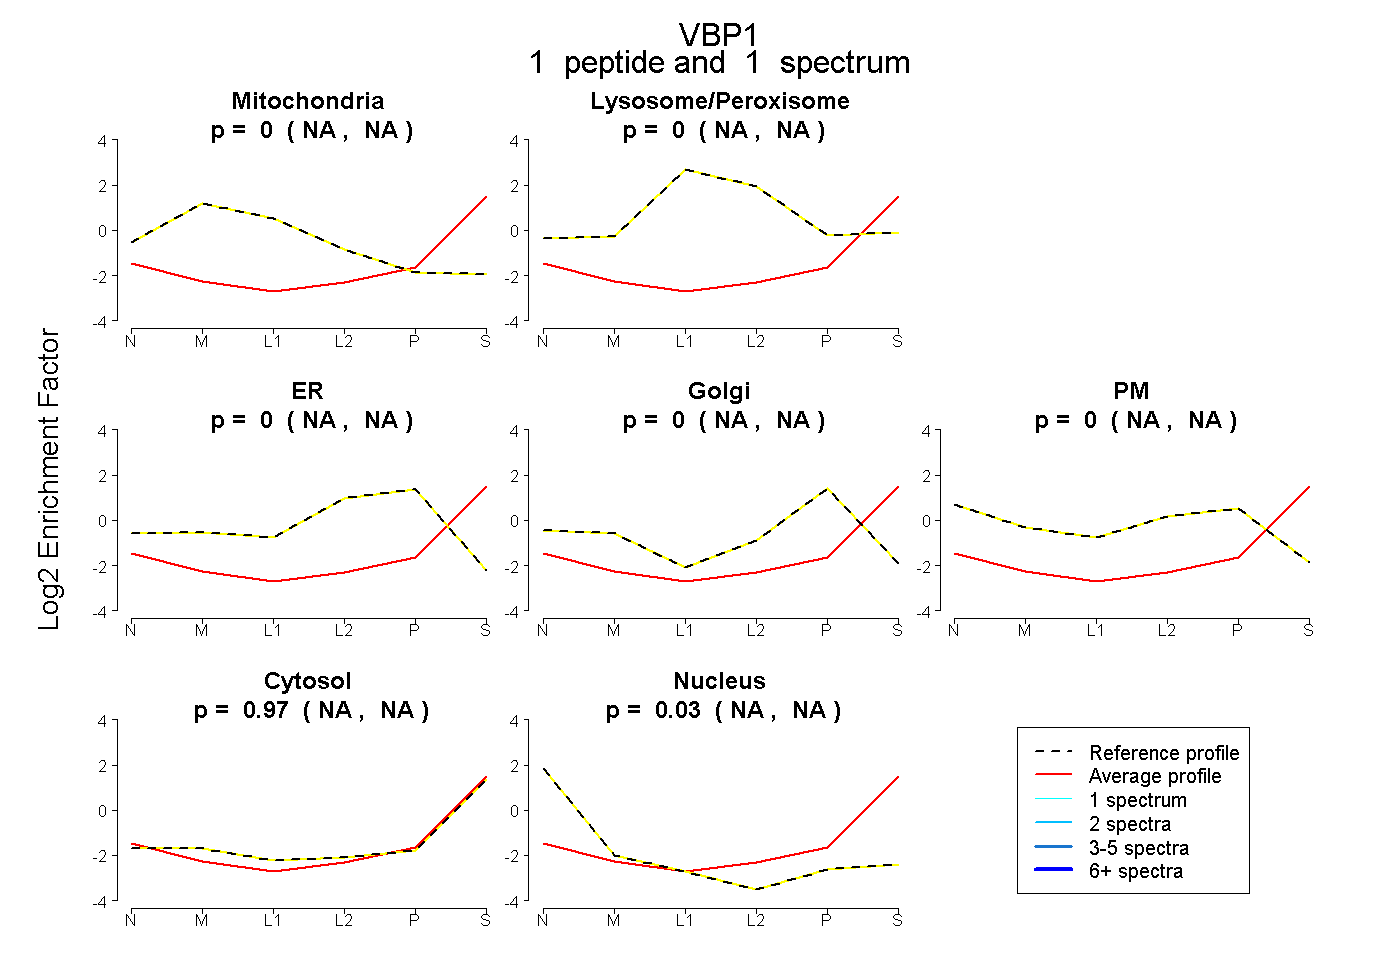
NA | NA
NA | NA
NA | NA
NA | NA
NA | NA
NA | NA
NA | NA
1peptide
spectra
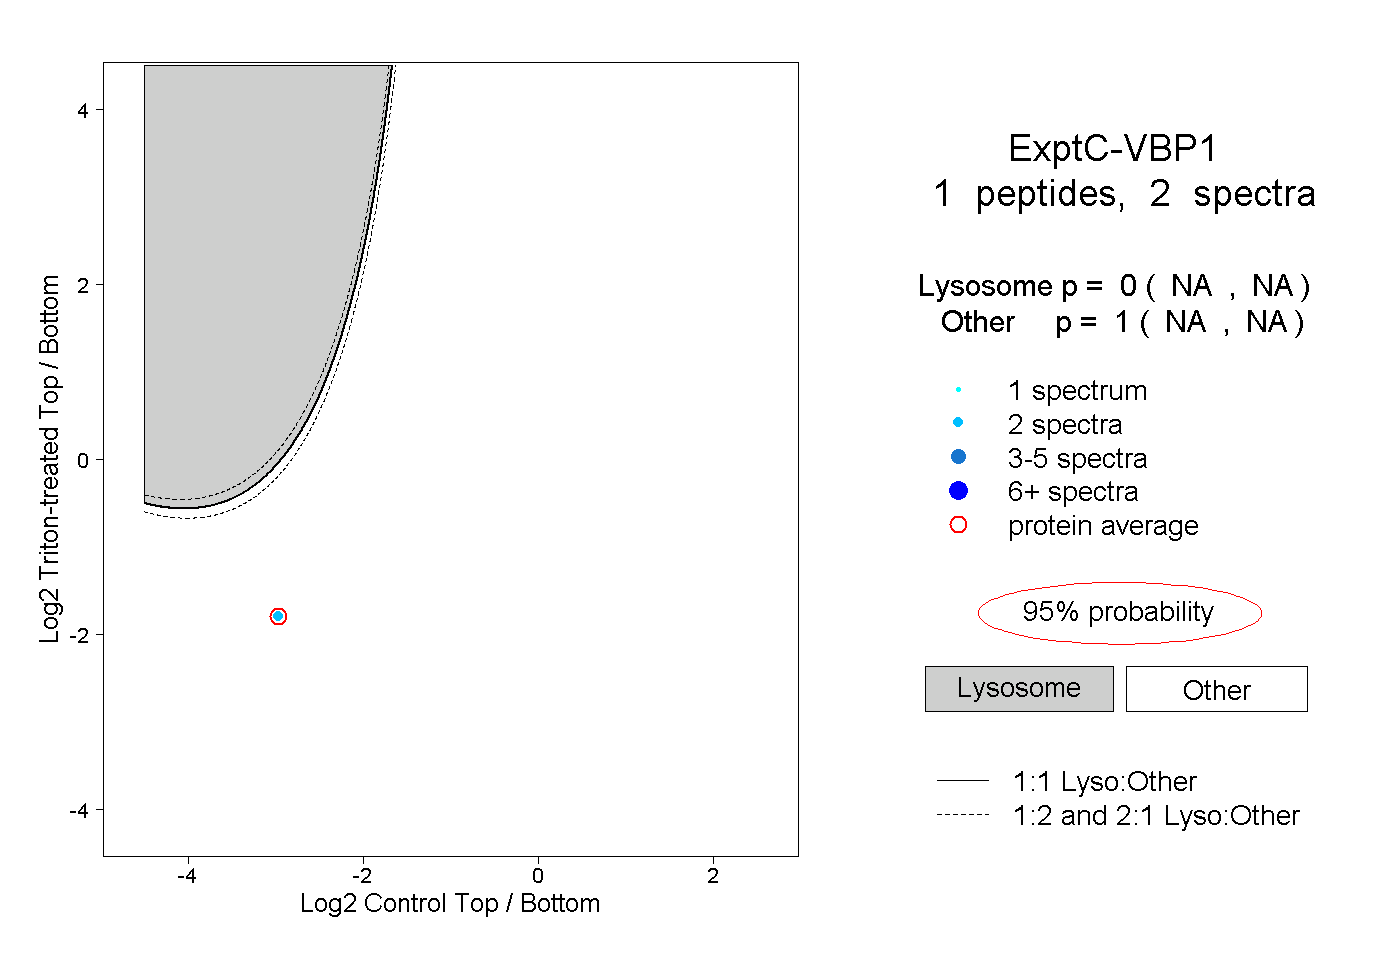
NA | NA
NA | NA
1peptide
spectrum
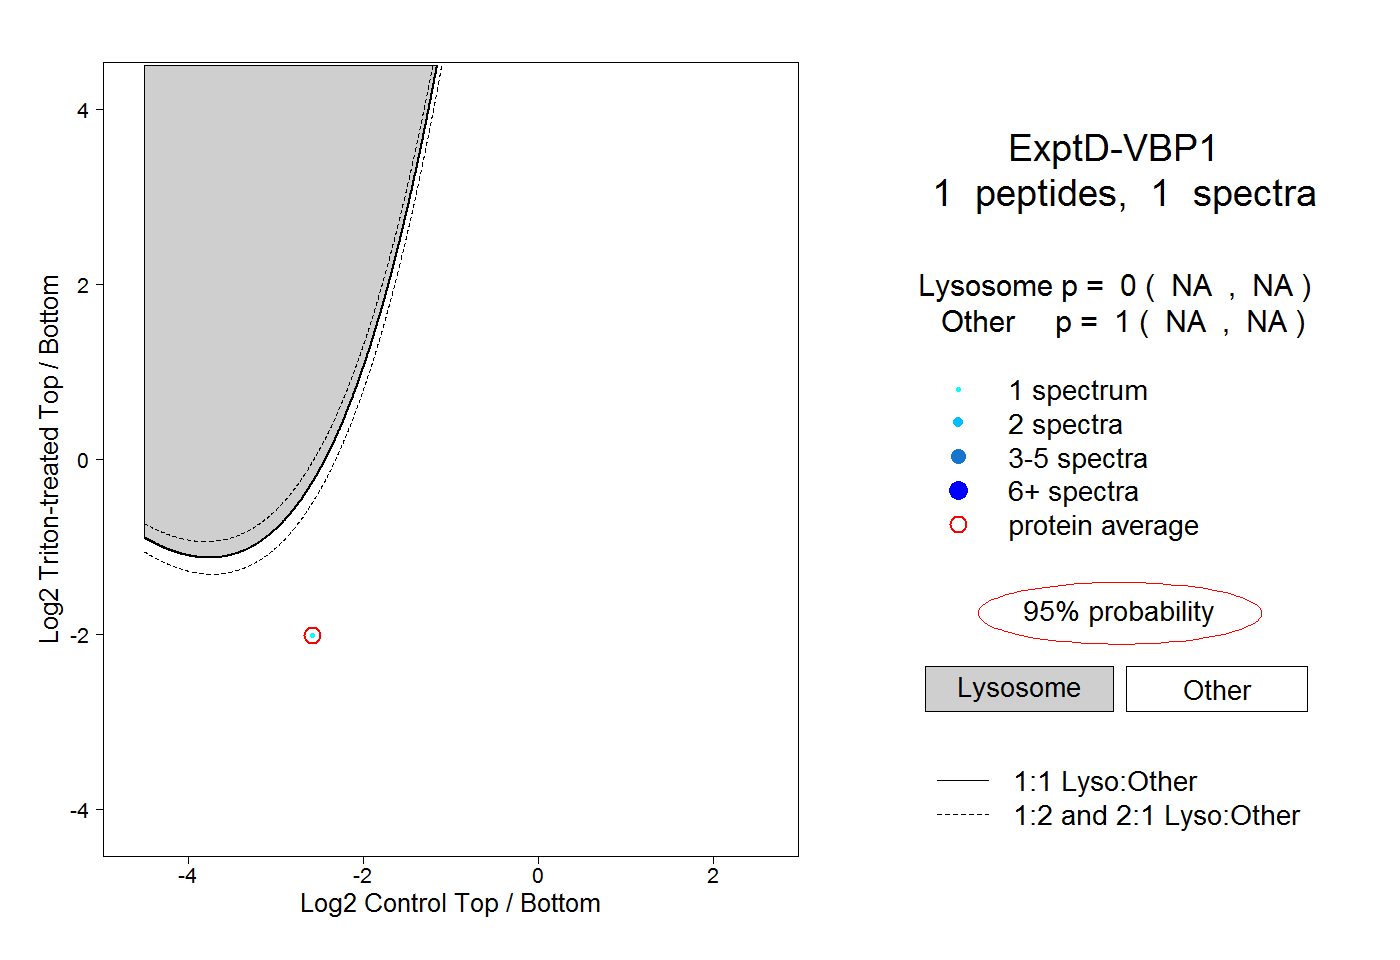
NA | NA
NA | NA