 3
3peptides
spectra
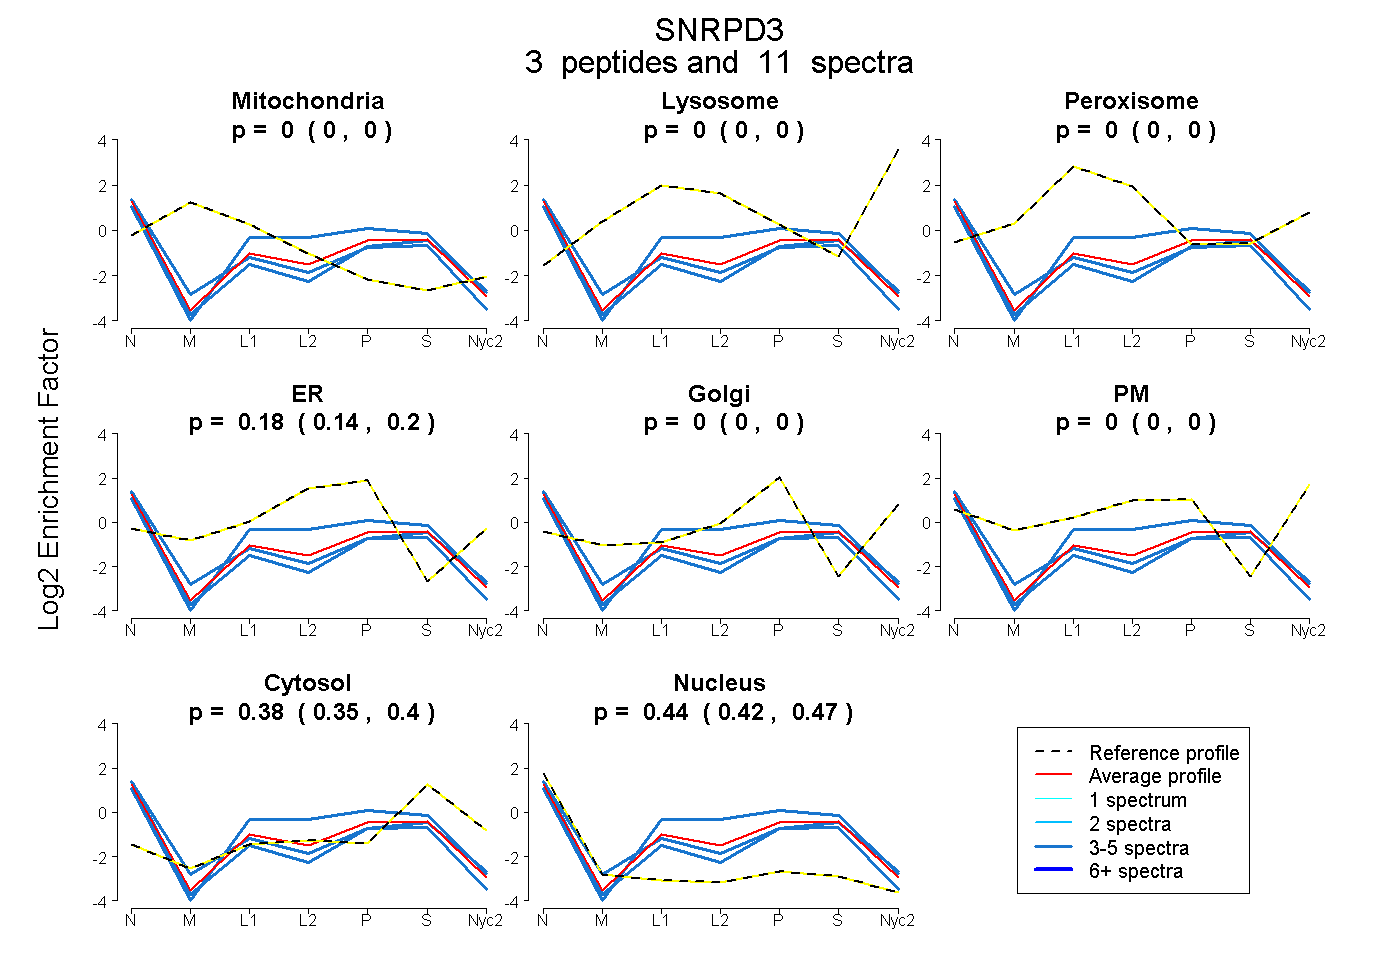
0.000 | 0.000
0.000 | 0.000
0.000 | 0.004
0.140 | 0.202
0.000 | 0.000
0.000 | 0.000
0.354 | 0.398
0.416 | 0.470
3peptides
spectra
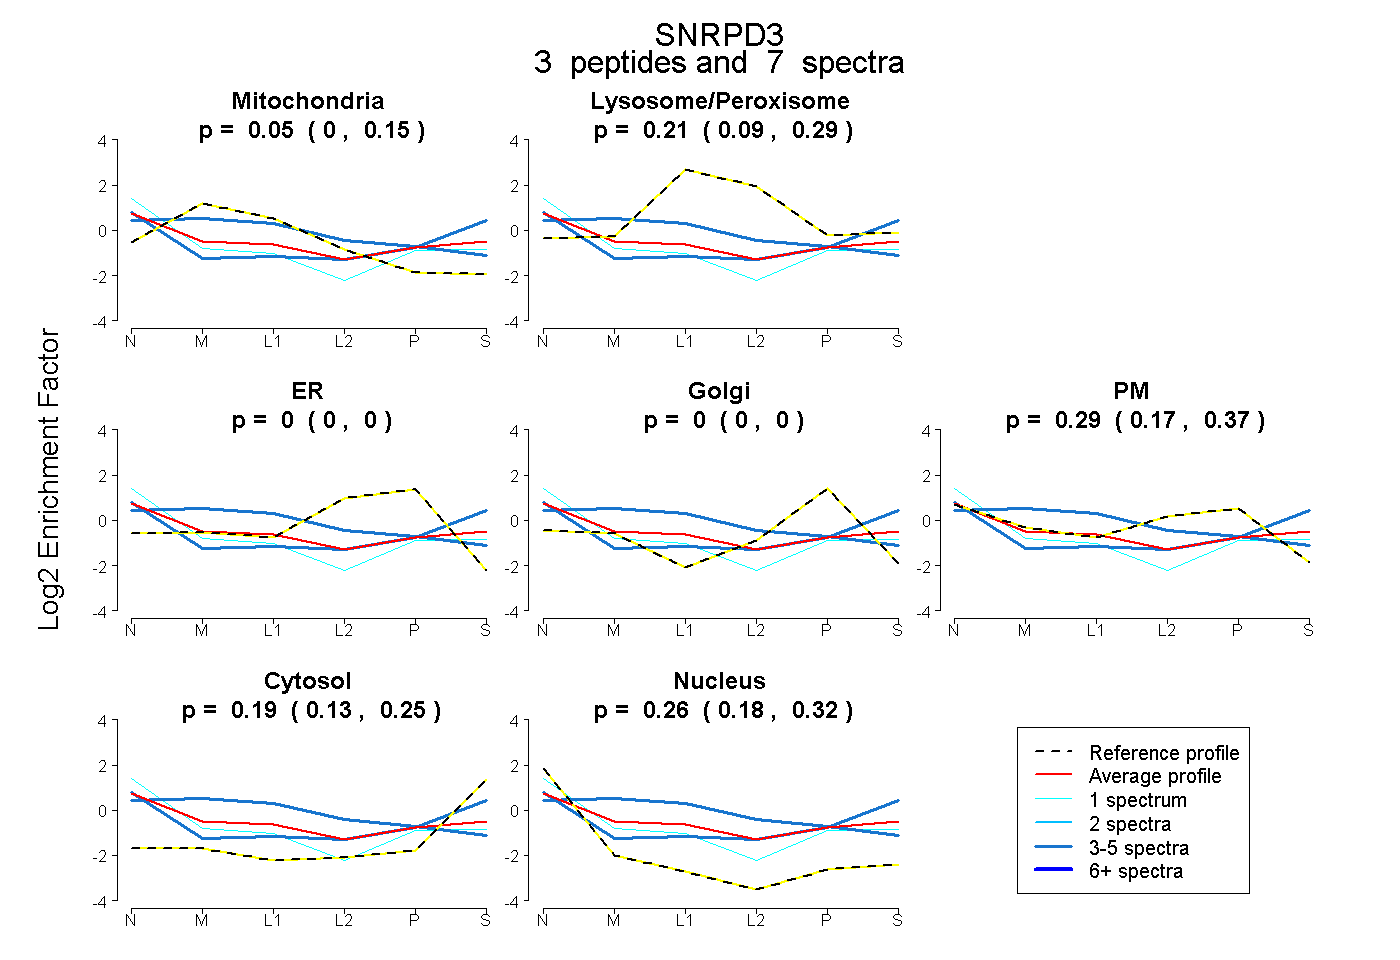
0.000 | 0.150
0.094 | 0.293
0.000 | 0.000
0.000 | 0.000
0.167 | 0.375
0.126 | 0.247
0.176 | 0.319
2peptides
spectra
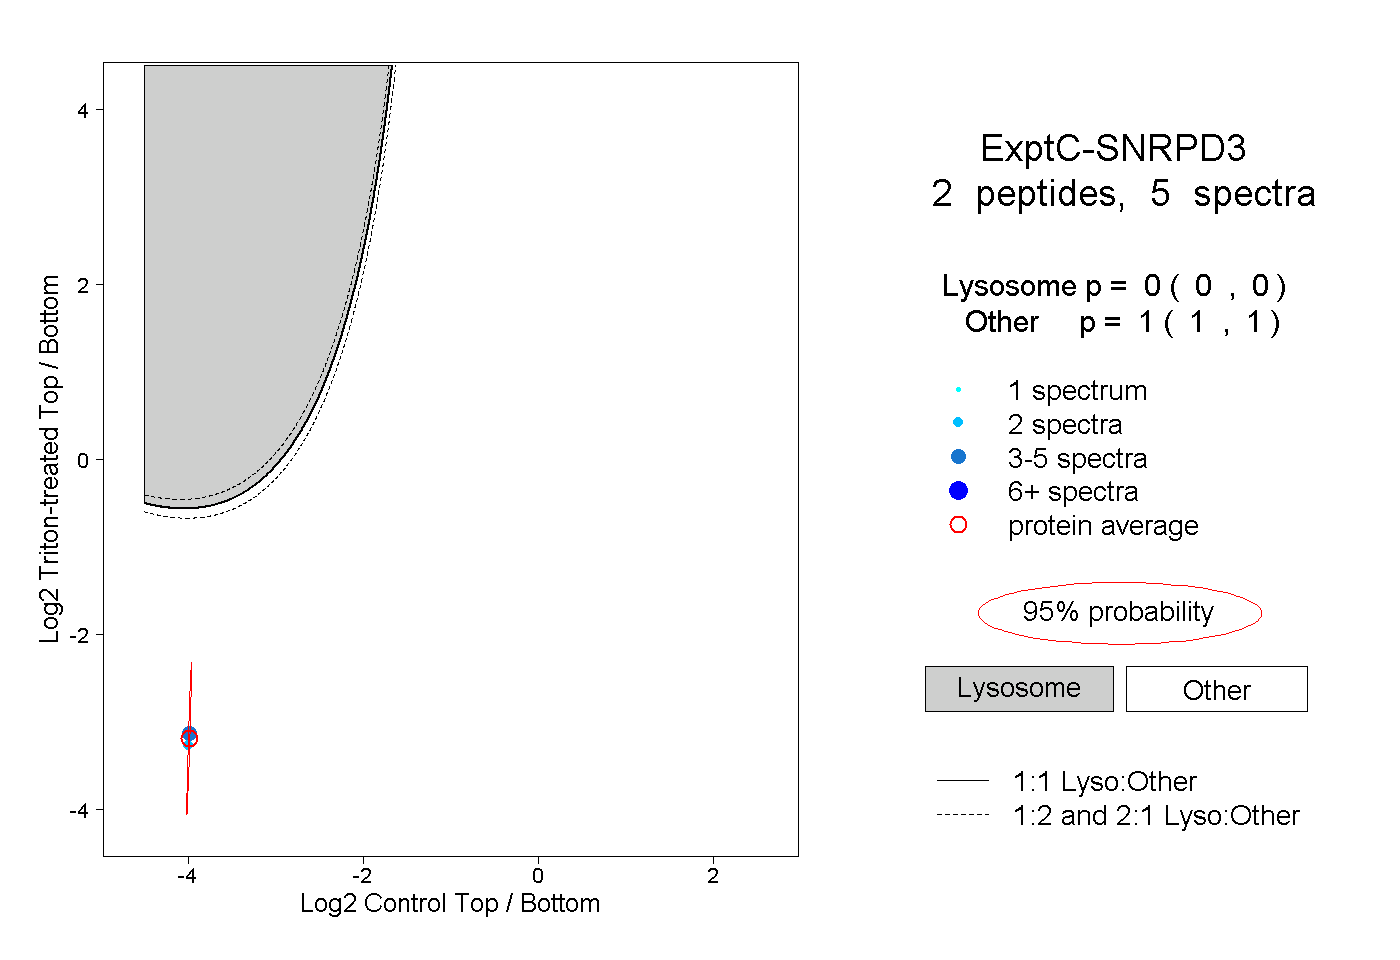
0.000 | 0.000
1.000 | 1.000