 5
5peptides
spectra
0.000 | 0.000
0.686 | 0.774
0.000 | 0.034
0.138 | 0.272
0.000 | 0.000
0.000 | 0.114
0.000 | 0.000
0.000 | 0.000
11peptides
spectra
0.000 | 0.000
1.000 | 1.000
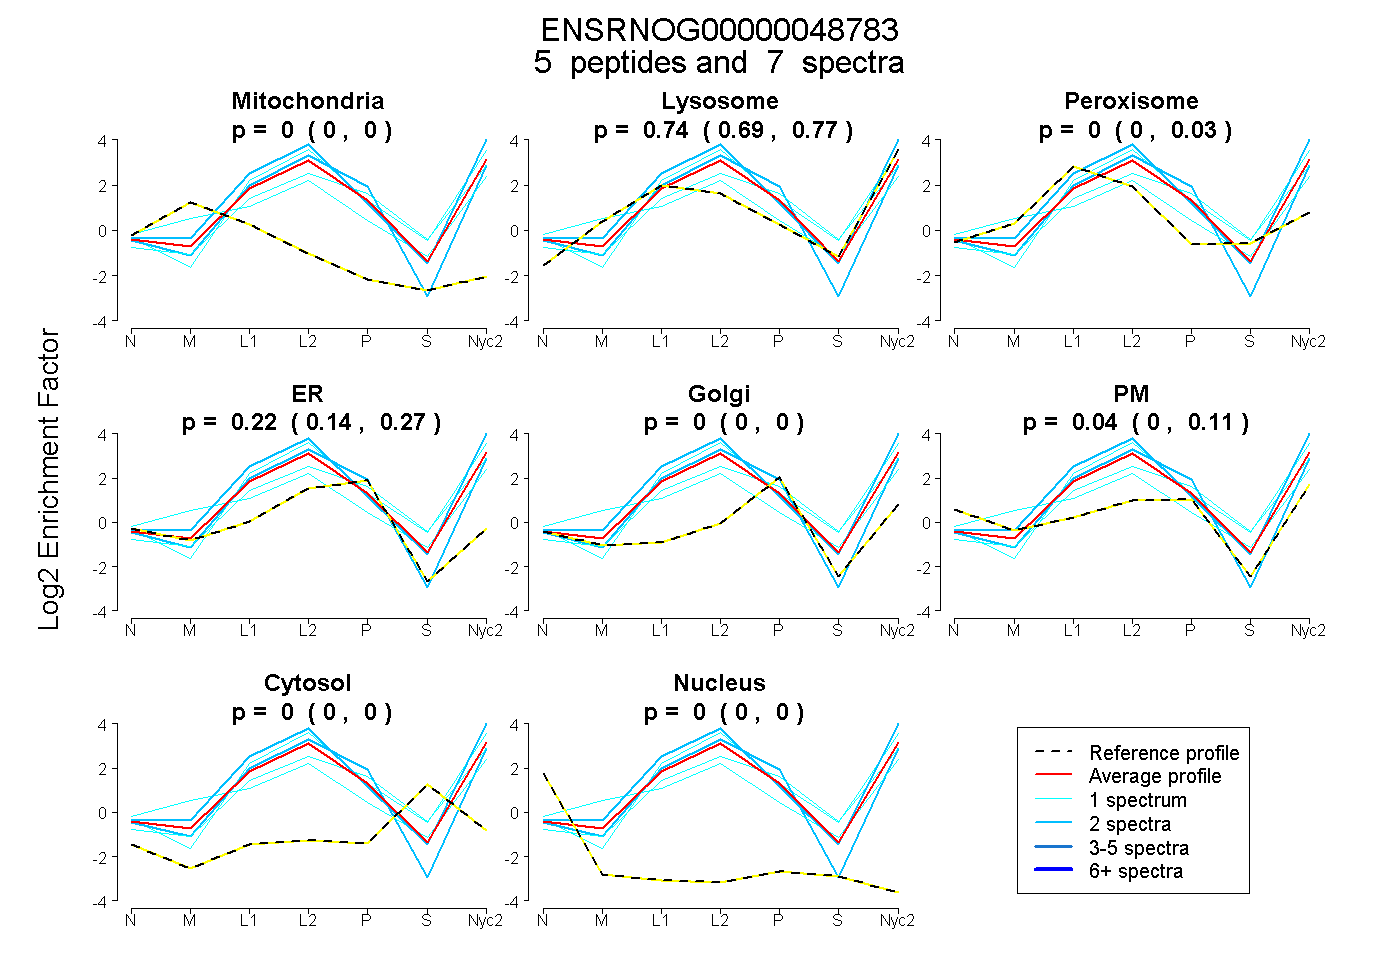
| Plot | Mito | Lyso | Perox | ER | Golgi | PM | Cytosol | Nucleus | |||||
| Expt A |
5 peptides |
7 spectra |
|
0.000 0.000 | 0.000 |
0.739 0.686 | 0.774 |
0.000 0.000 | 0.034 |
0.224 0.138 | 0.272 |
0.000 0.000 | 0.000 |
0.038 0.000 | 0.114 |
0.000 0.000 | 0.000 |
0.000 0.000 | 0.000 |
||
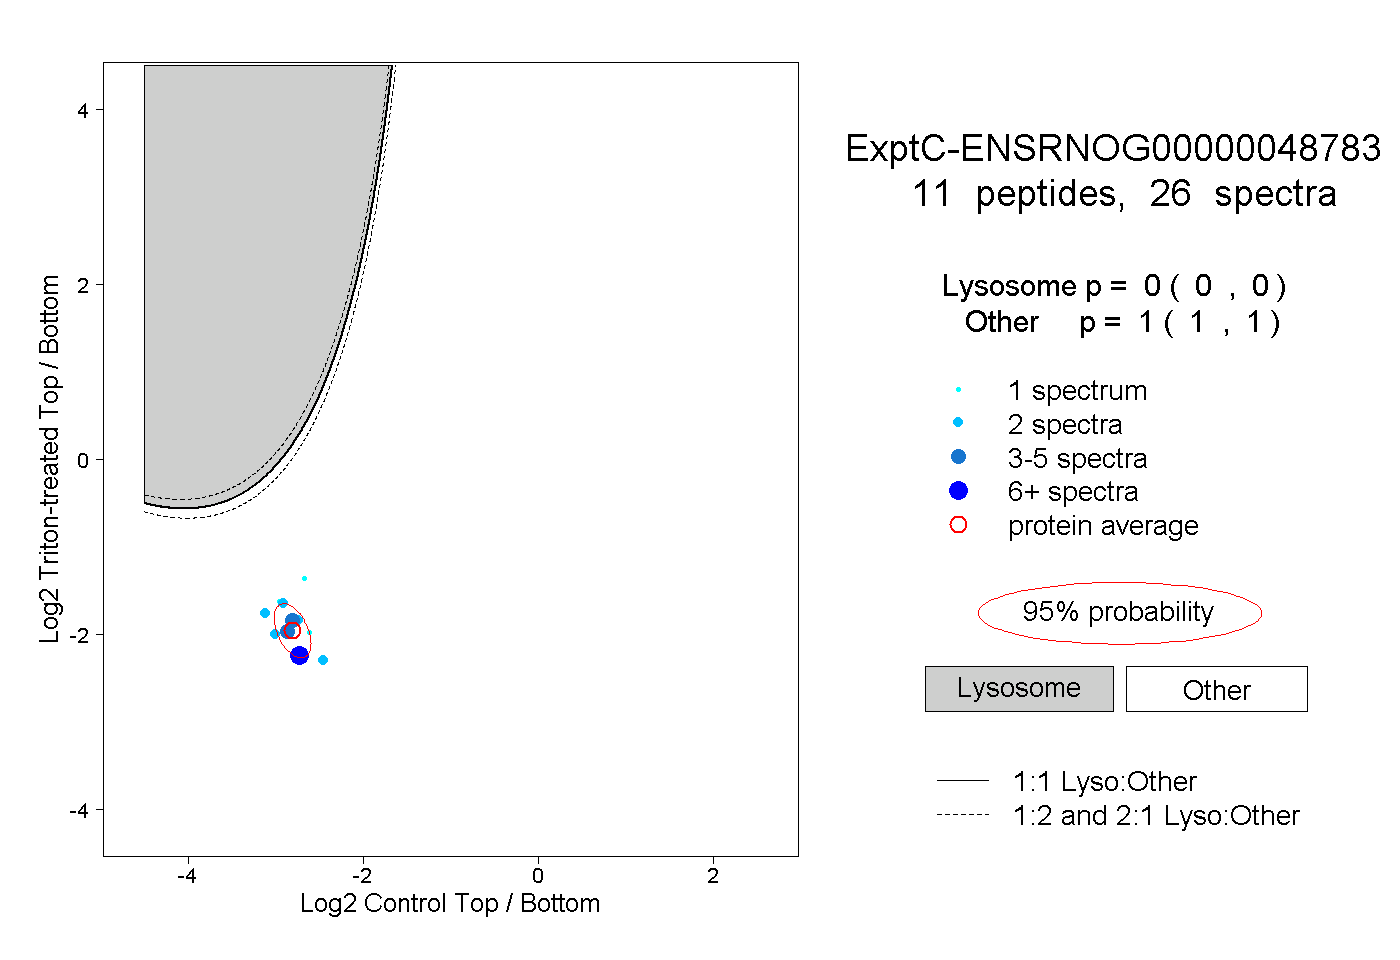
| Plot | Lyso | Other | |||||||||||
| Expt C |
11 peptides |
26 spectra |
|
0.000 0.000 | 0.000 |
1.000 1.000 | 1.000 |
| 3 spectra, TIGILSAK | 0.000 | 1.000 | ||||||||
| 2 spectra, GATHCYR | 0.000 | 1.000 | ||||||||
| 1 spectrum, SALLGSK | 0.000 | 1.000 | ||||||||
| 1 spectrum, ILEDLSTPTVPGSLR | 0.000 | 1.000 | ||||||||
| 2 spectra, GGEIISK | 0.000 | 1.000 | ||||||||
| 6 spectra, GCTAAEDHK | 0.000 | 1.000 | ||||||||
| 2 spectra, SLLGNSK | 0.000 | 1.000 | ||||||||
| 2 spectra, TGPGLAVISYTR | 0.000 | 1.000 | ||||||||
| 1 spectrum, GDIALR | 0.000 | 1.000 | ||||||||
| 2 spectra, GGGFISDLK | 0.000 | 1.000 | ||||||||
| 4 spectra, IGPVDVSEDCSPR | 0.000 | 1.000 |
| Plot | Lyso | Other | |||||||||||
| Expt D |
2 peptides |
2 spectra |
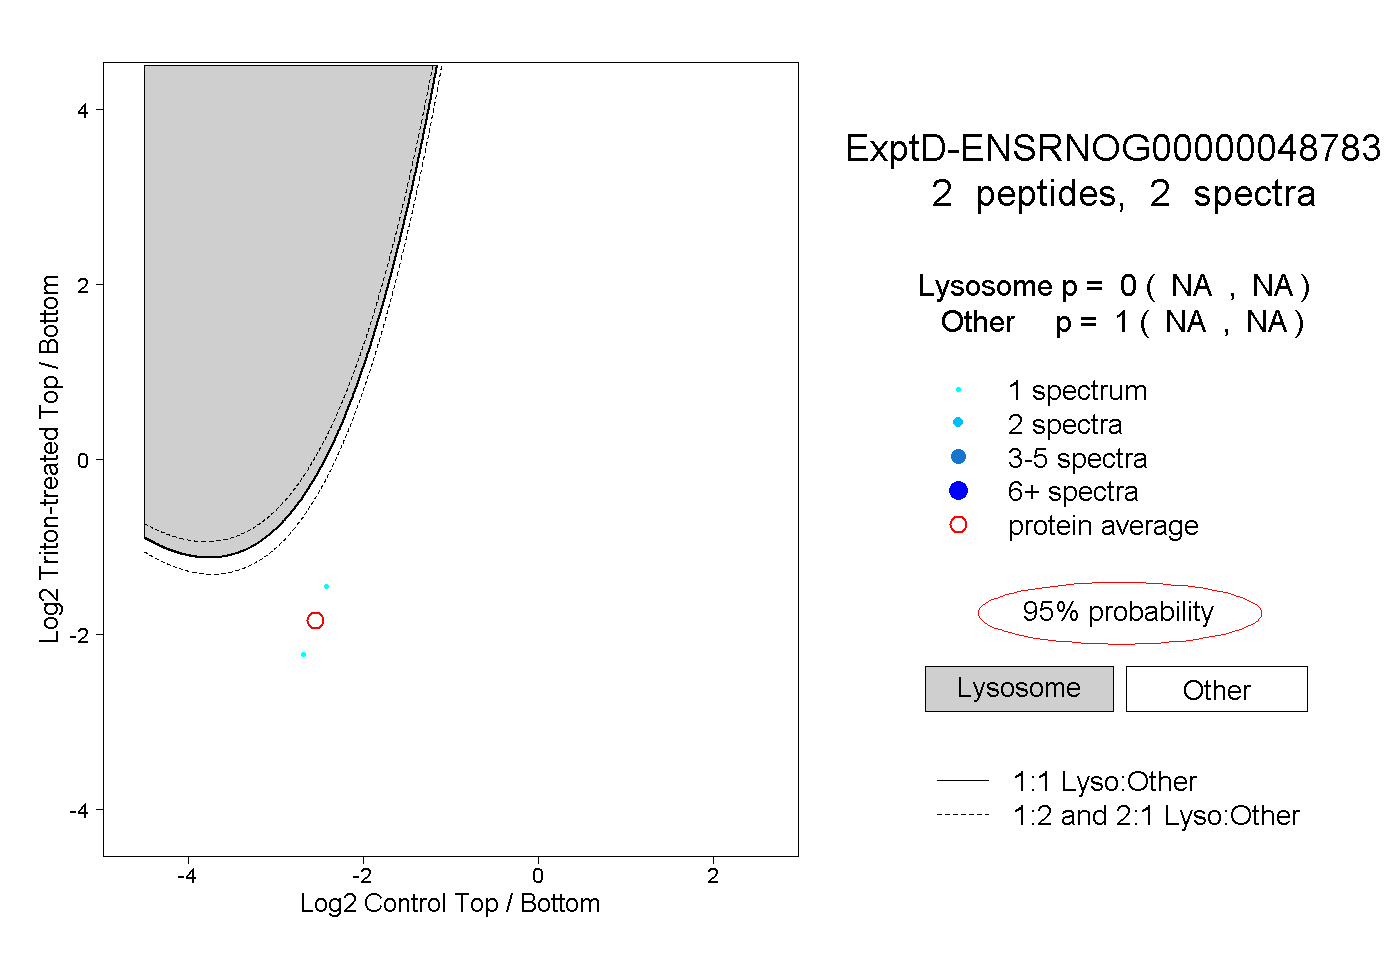 |
0.000 NA | NA |
1.000 NA | NA |