 3
3peptides
spectra
0.000 | 0.000
0.000 | 0.000
0.000 | 0.000
0.000 | 0.000
0.065 | 0.201
0.000 | 0.000
0.169 | 0.369
0.508 | 0.640
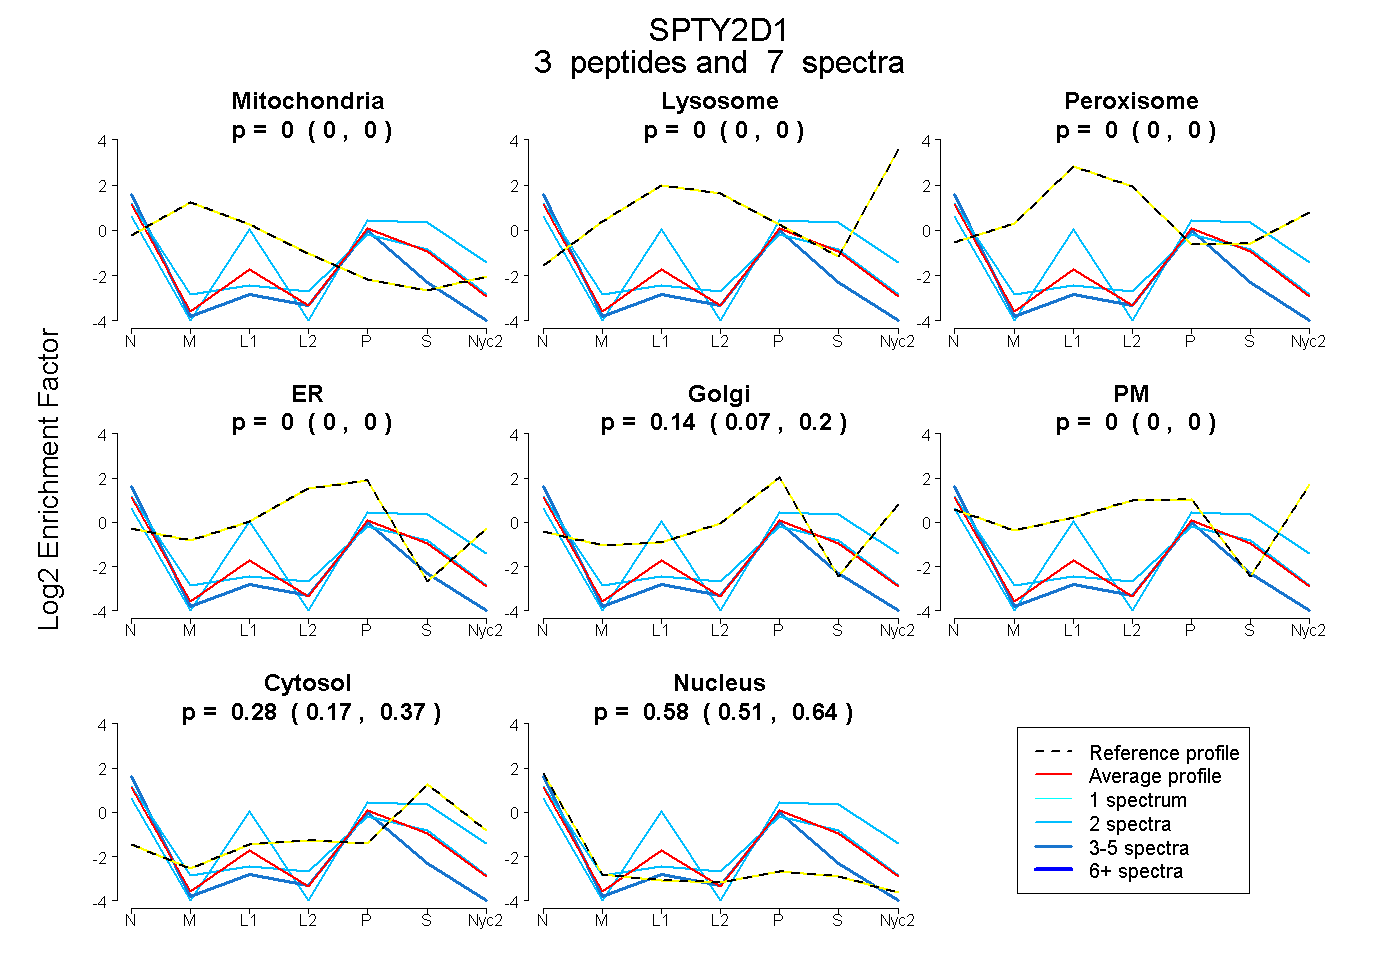
| Plot | Mito | Lyso | Perox | ER | Golgi | PM | Cytosol | Nucleus | |||||
| Expt A |
3 peptides |
7 spectra |
|
0.000 0.000 | 0.000 |
0.000 0.000 | 0.000 |
0.000 0.000 | 0.000 |
0.000 0.000 | 0.000 |
0.141 0.065 | 0.201 |
0.000 0.000 | 0.000 |
0.277 0.169 | 0.369 |
0.582 0.508 | 0.640 |