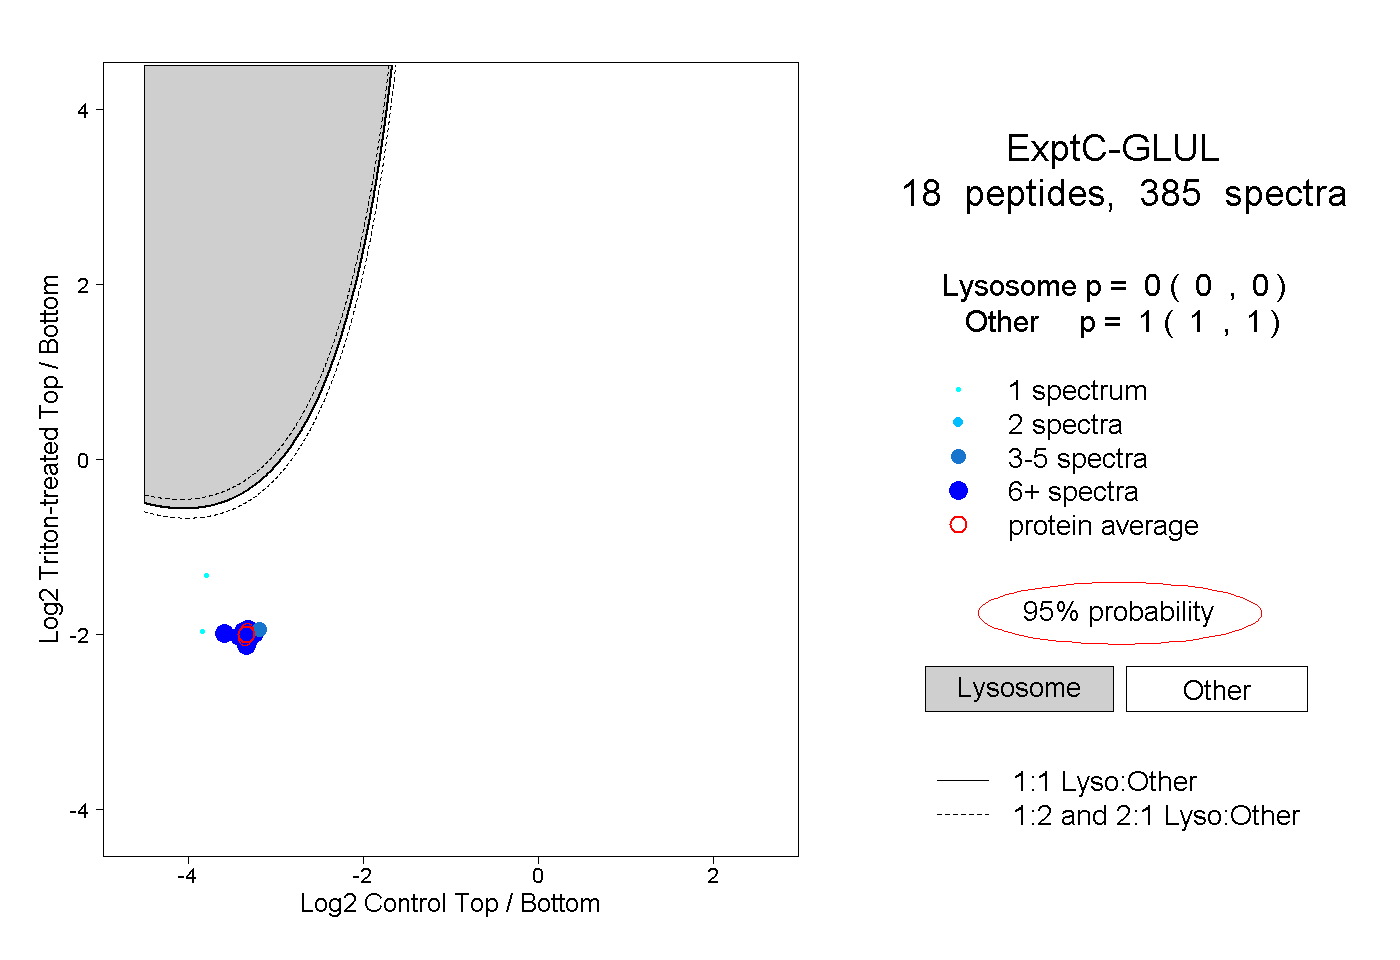
18
18peptides
spectra
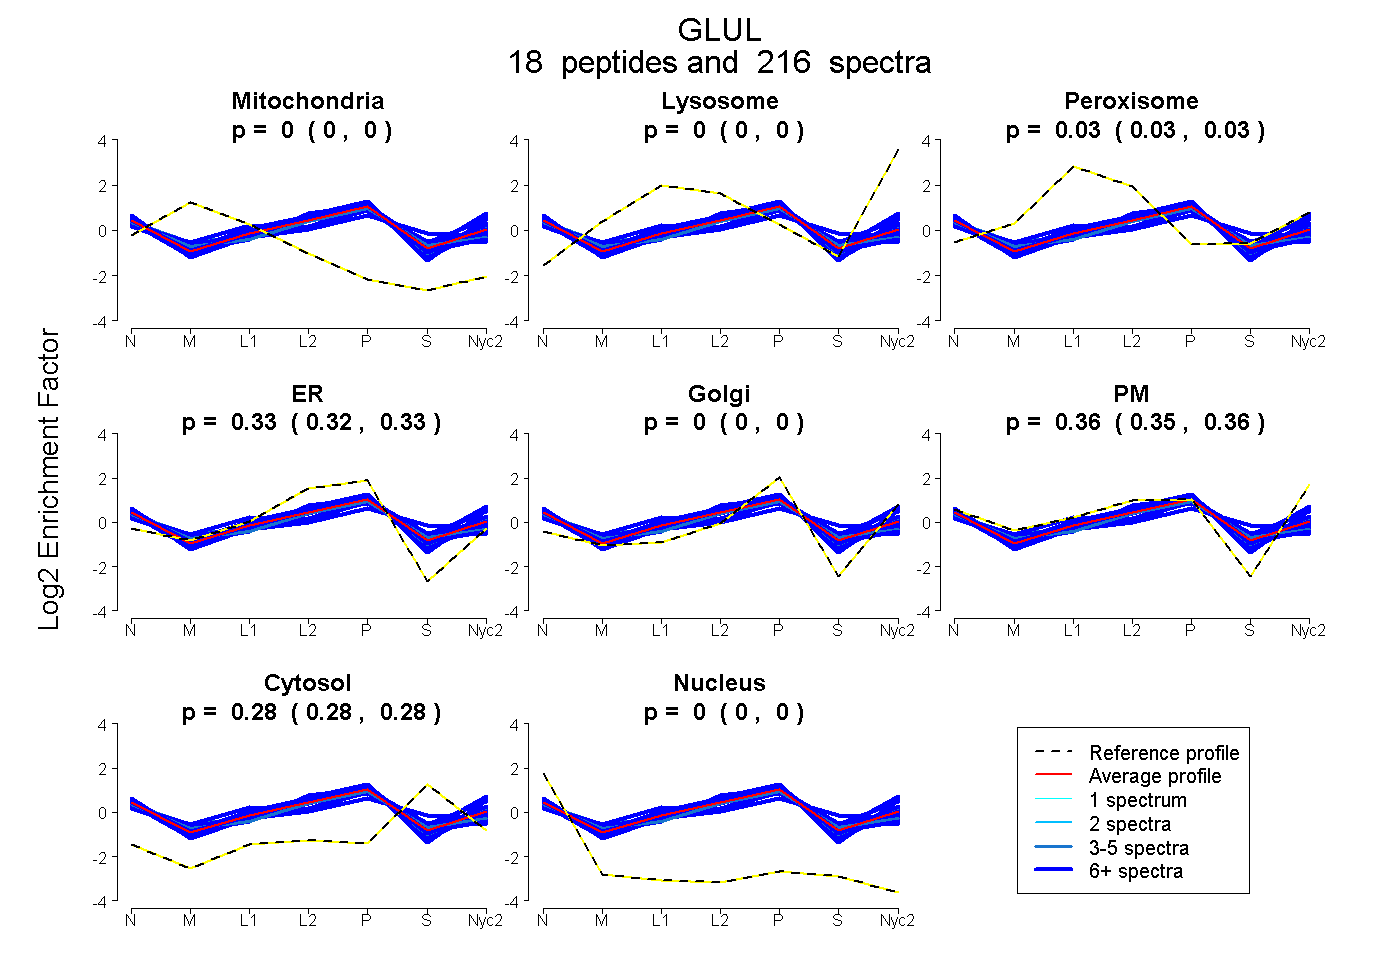
0.000 | 0.000
0.000 | 0.000
0.030 | 0.033
0.322 | 0.329
0.000 | 0.000
0.353 | 0.362
0.281 | 0.284
0.001 | 0.004
14peptides
spectra
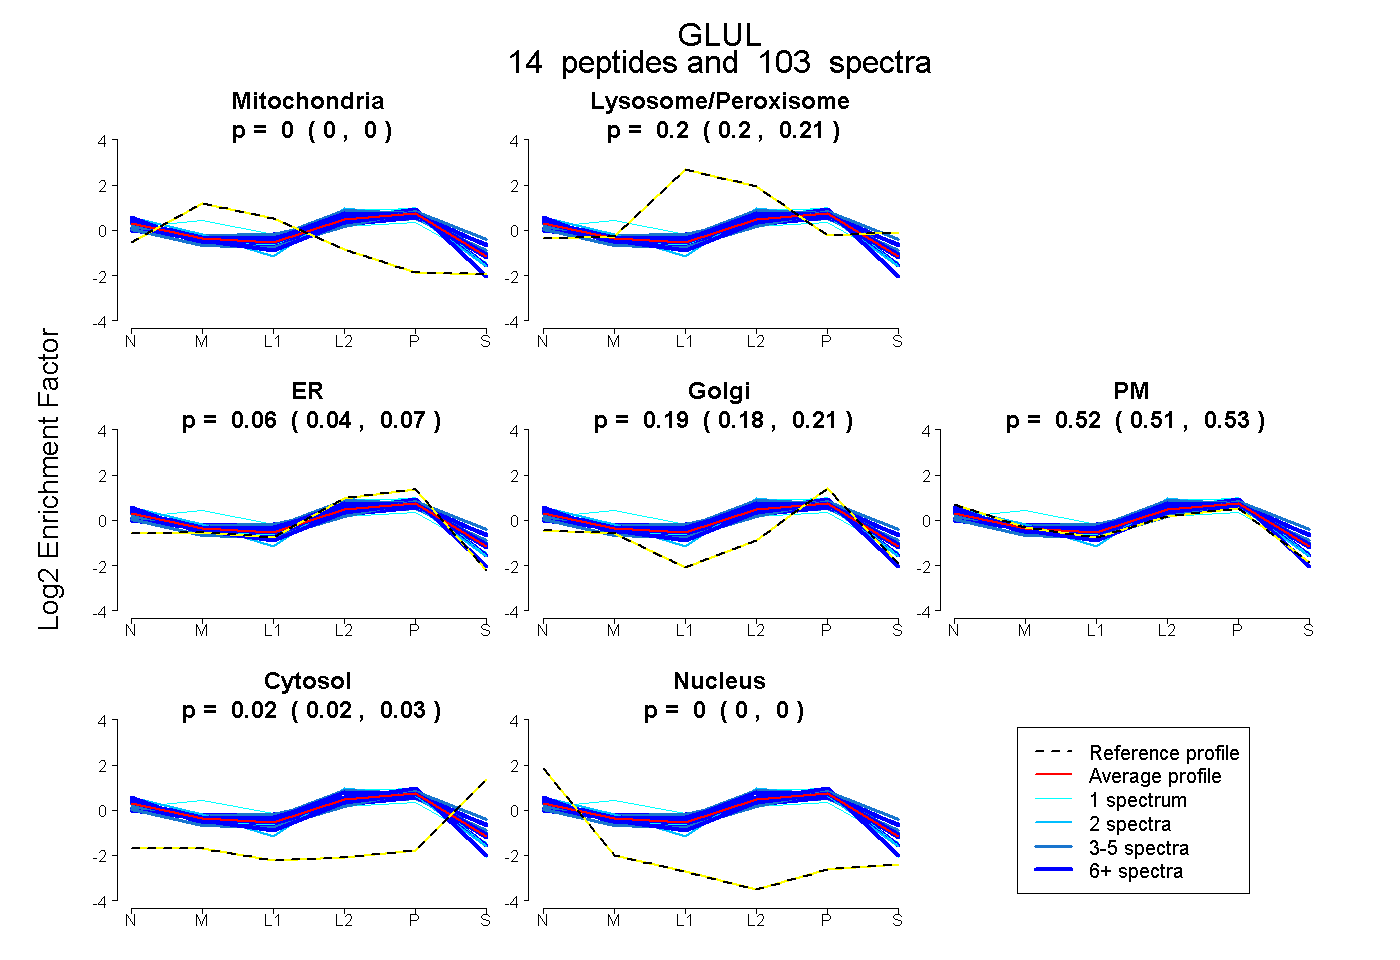
0.000 | 0.000
0.195 | 0.210
0.042 | 0.069
0.178 | 0.206
0.513 | 0.531
0.020 | 0.027
0.000 | 0.000