 2
2peptides
spectra
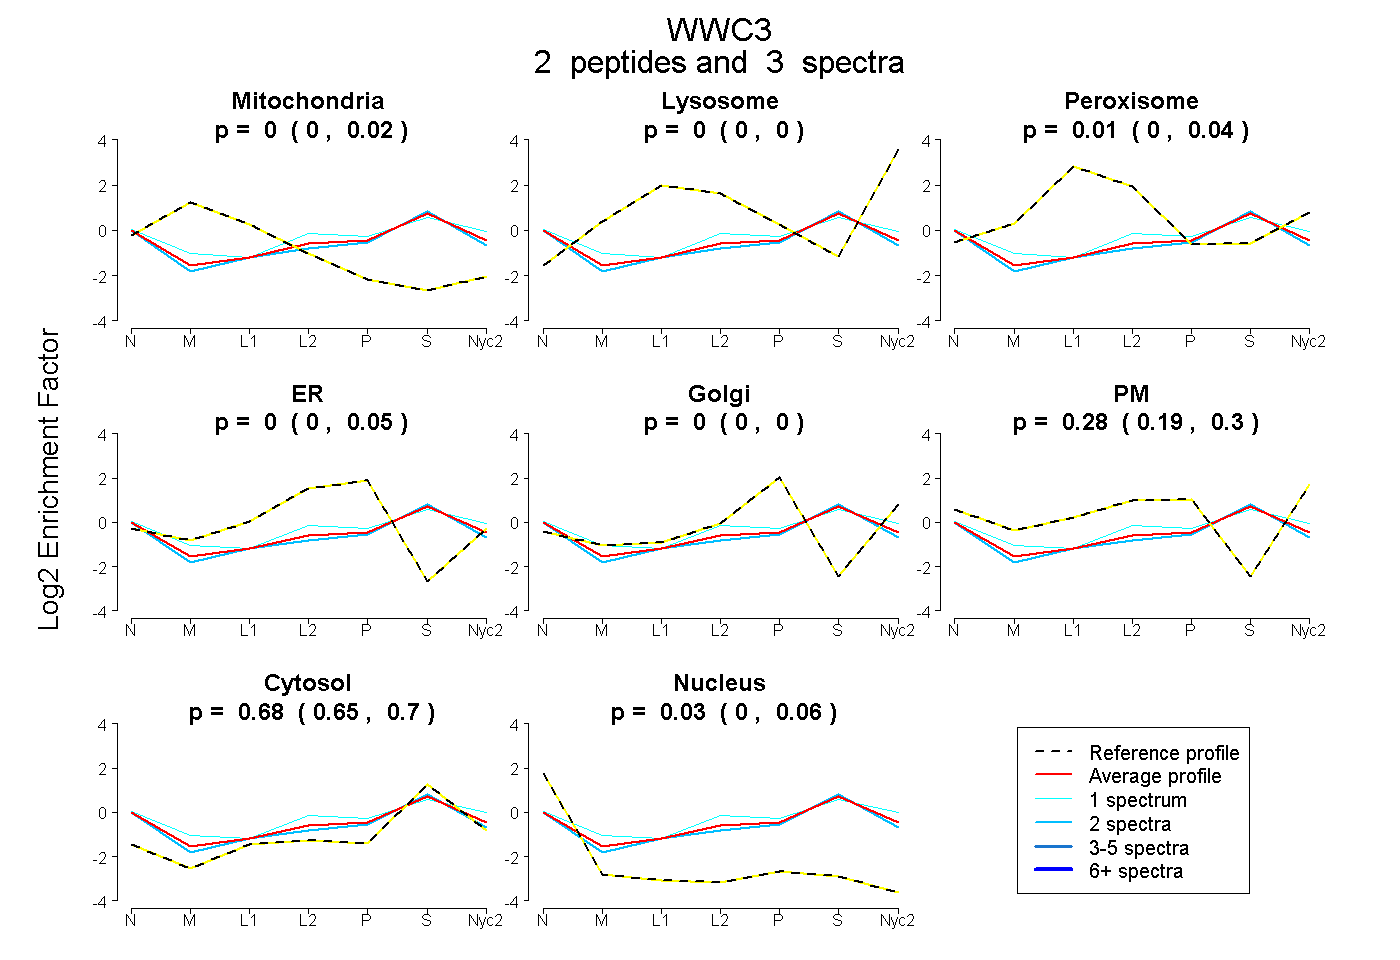
0.000 | 0.024
0.000 | 0.000
0.000 | 0.039
0.000 | 0.048
0.000 | 0.000
0.190 | 0.300
0.649 | 0.705
0.002 | 0.056
| Plot | Mito | Lyso | Perox | ER | Golgi | PM | Cytosol | Nucleus | |||||
| Expt A |
2 peptides |
3 spectra |
|
0.000 0.000 | 0.024 |
0.000 0.000 | 0.000 |
0.006 0.000 | 0.039 |
0.000 0.000 | 0.048 |
0.000 0.000 | 0.000 |
0.276 0.190 | 0.300 |
0.683 0.649 | 0.705 |
0.034 0.002 | 0.056 |
| 2 spectra, ATSAQGATER | 0.000 | 0.000 | 0.009 | 0.000 | 0.000 | 0.221 | 0.712 | 0.058 | ||
| 1 spectrum, LCEDDGR | 0.000 | 0.000 | 0.012 | 0.000 | 0.000 | 0.376 | 0.612 | 0.000 |
| Plot | Lyso | Other | |||||||||||
| Expt C |
1 peptide |
1 spectrum |
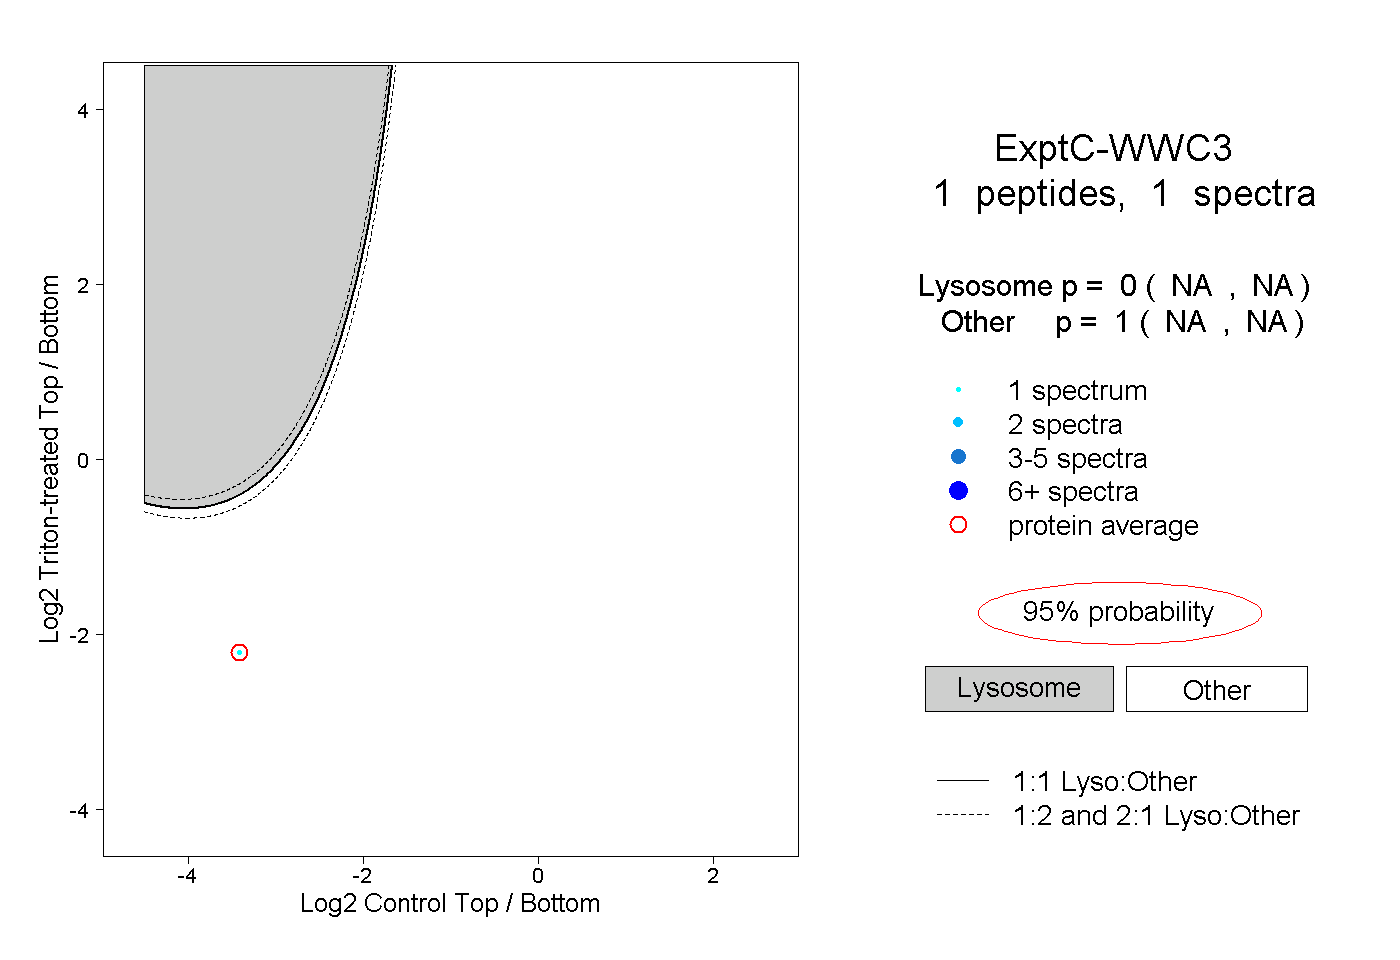 |
0.000 NA | NA |
1.000 NA | NA |