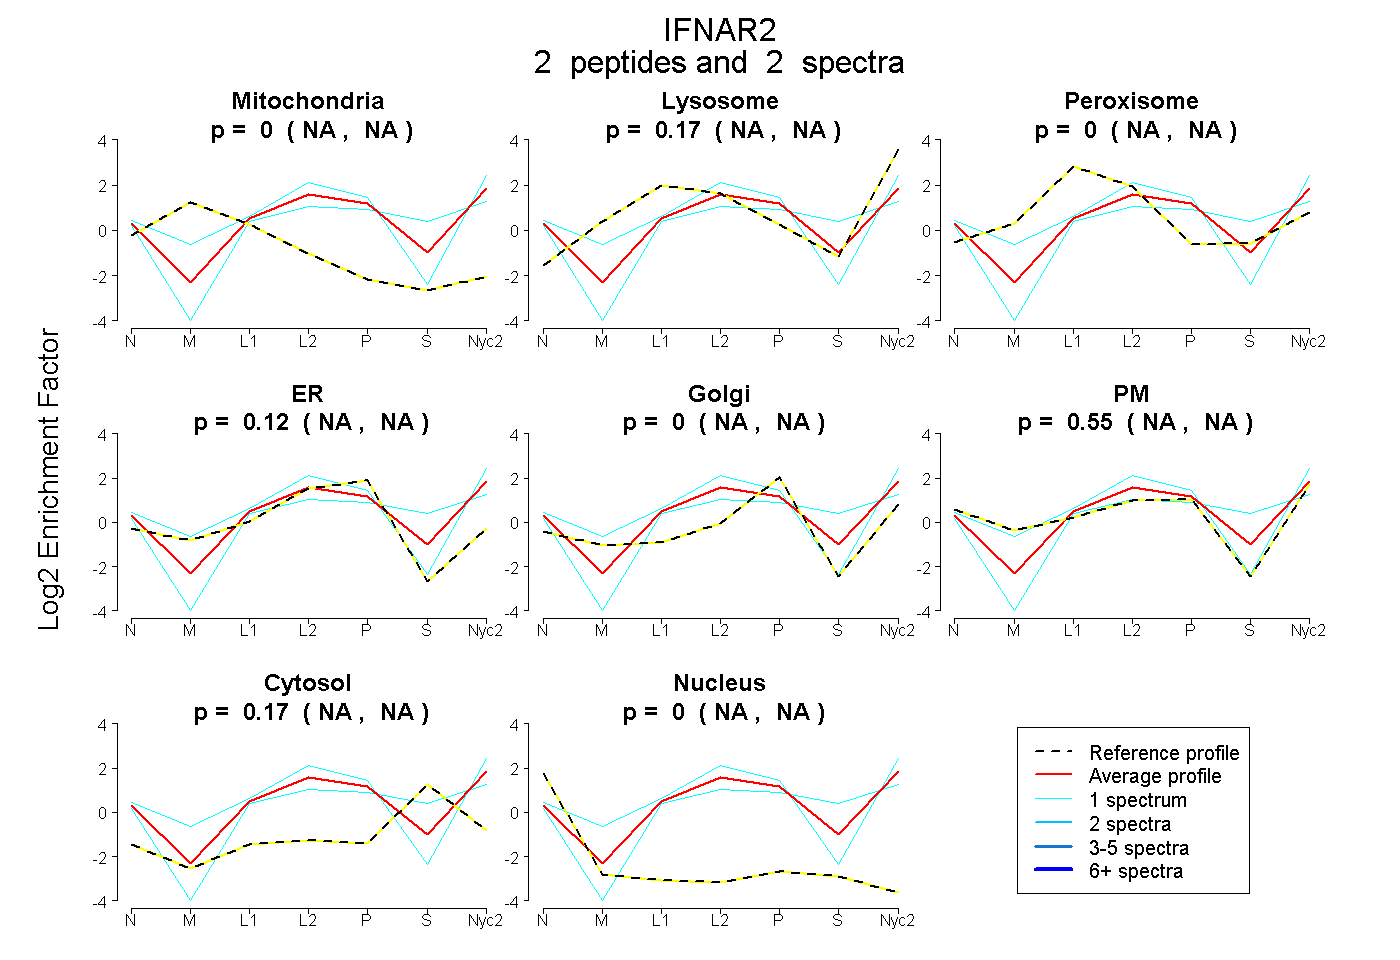
 2
2peptides
spectra
NA | NA
NA | NA
NA | NA
NA | NA
NA | NA
NA | NA
NA | NA
NA | NA
| Plot | Mito | Lyso | Perox | ER | Golgi | PM | Cytosol | Nucleus | |||||
| Expt A |
2 peptides |
2 spectra |
|
0.000 NA | NA |
0.166 NA | NA |
0.000 NA | NA |
0.121 NA | NA |
0.000 NA | NA |
0.546 NA | NA |
0.168 NA | NA |
0.000 NA | NA |
| 1 spectrum, LFGESLWK | 0.000 | 0.196 | 0.000 | 0.045 | 0.000 | 0.759 | 0.000 | 0.000 | ||
| 1 spectrum, ETYVPIIVVHR | 0.000 | 0.114 | 0.000 | 0.103 | 0.000 | 0.319 | 0.464 | 0.000 |
| Plot | Lyso | Other | |||||||||||
| Expt C |
5 peptides |
10 spectra |
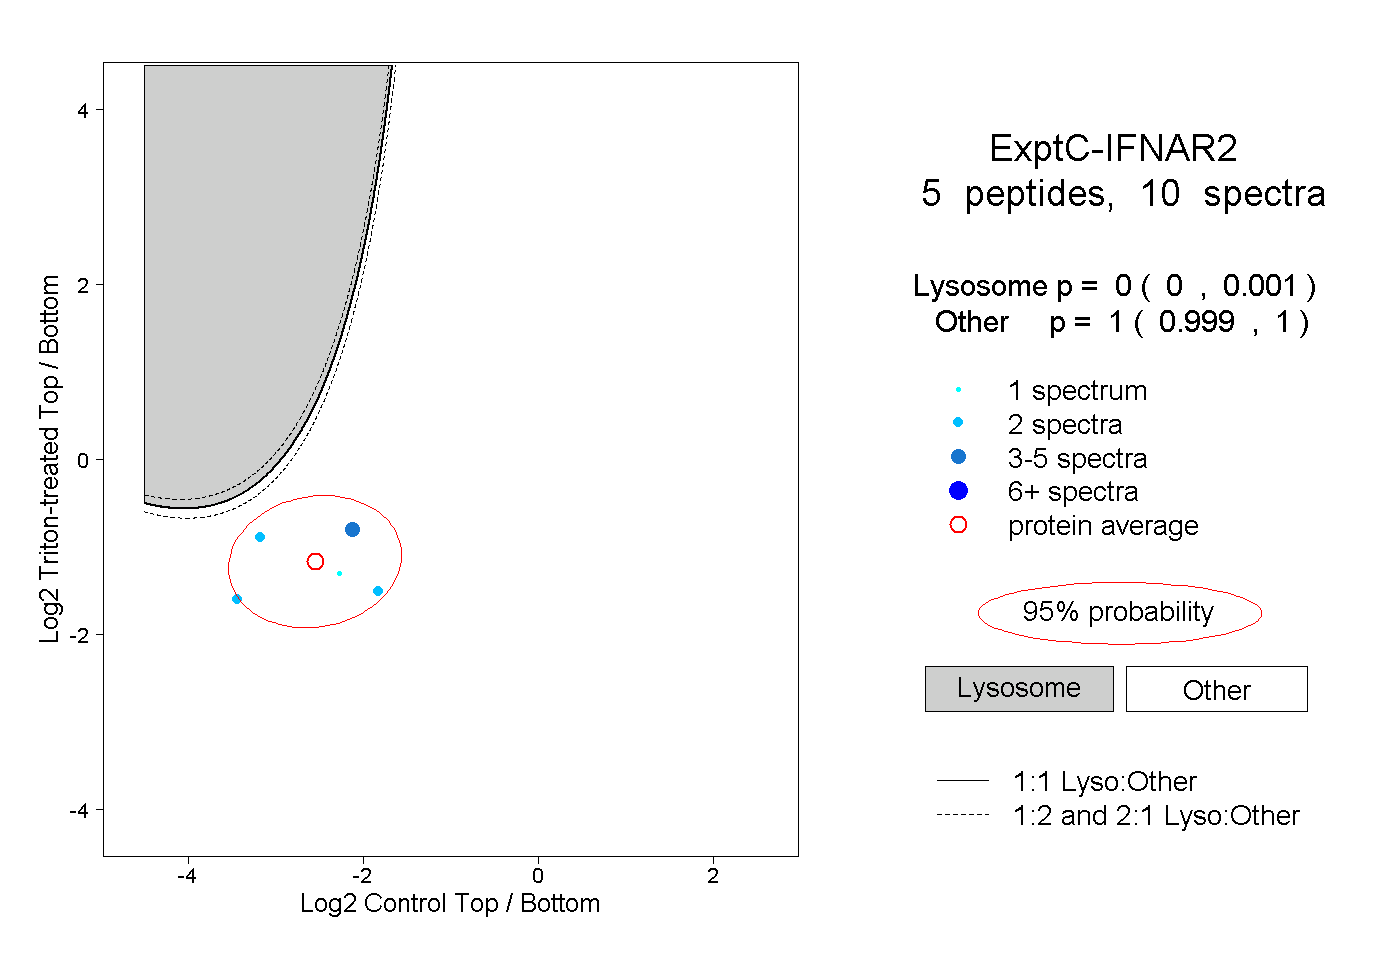 |
0.000 0.000 | 0.001 |
1.000 0.999 | 1.000 |