 6
6peptides
spectra
0.000 | 0.000
0.517 | 0.581
0.000 | 0.001
0.000 | 0.073
0.000 | 0.000
0.263 | 0.362
0.078 | 0.119
0.000 | 0.000
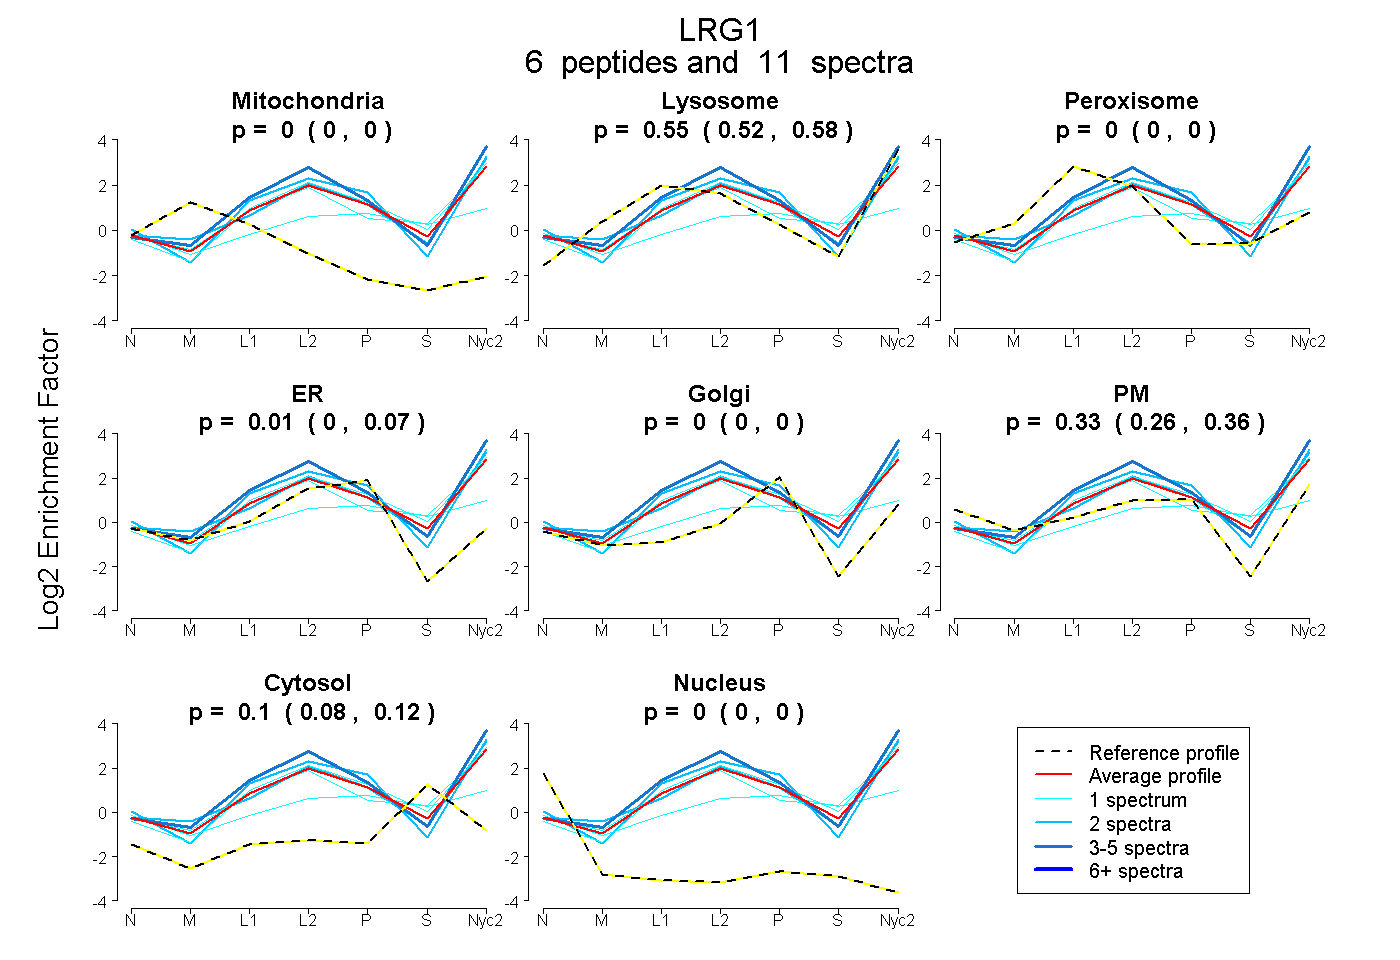
| Plot | Mito | Lyso | Perox | ER | Golgi | PM | Cytosol | Nucleus | |||||
| Expt A |
6 peptides |
11 spectra |
|
0.000 0.000 | 0.000 |
0.552 0.517 | 0.581 |
0.000 0.000 | 0.001 |
0.013 0.000 | 0.073 |
0.000 0.000 | 0.000 |
0.334 0.263 | 0.362 |
0.101 0.078 | 0.119 |
0.000 0.000 | 0.000 |
| 1 spectrum, ECLILQSVK | 0.000 | 0.143 | 0.053 | 0.053 | 0.000 | 0.369 | 0.383 | 0.000 | ||
| 2 spectra, LHLEGNR | 0.000 | 0.579 | 0.000 | 0.000 | 0.000 | 0.388 | 0.033 | 0.000 | ||
| 4 spectra, WLAANR | 0.000 | 0.749 | 0.000 | 0.000 | 0.000 | 0.251 | 0.000 | 0.000 | ||
| 2 spectra, ENQLQEASAR | 0.000 | 0.516 | 0.000 | 0.040 | 0.000 | 0.444 | 0.000 | 0.000 | ||
| 1 spectrum, SSAALNTLVLR | 0.000 | 0.626 | 0.000 | 0.070 | 0.000 | 0.172 | 0.132 | 0.000 | ||
| 1 spectrum, LQELSPGLLAPVPR | 0.000 | 0.616 | 0.042 | 0.000 | 0.000 | 0.157 | 0.185 | 0.000 |
| Plot | Mito | Lyso or Perox | ER | Golgi | PM | Cytosol | Nucleus | ||||||
| Expt B |
1 peptide |
1 spectrum |
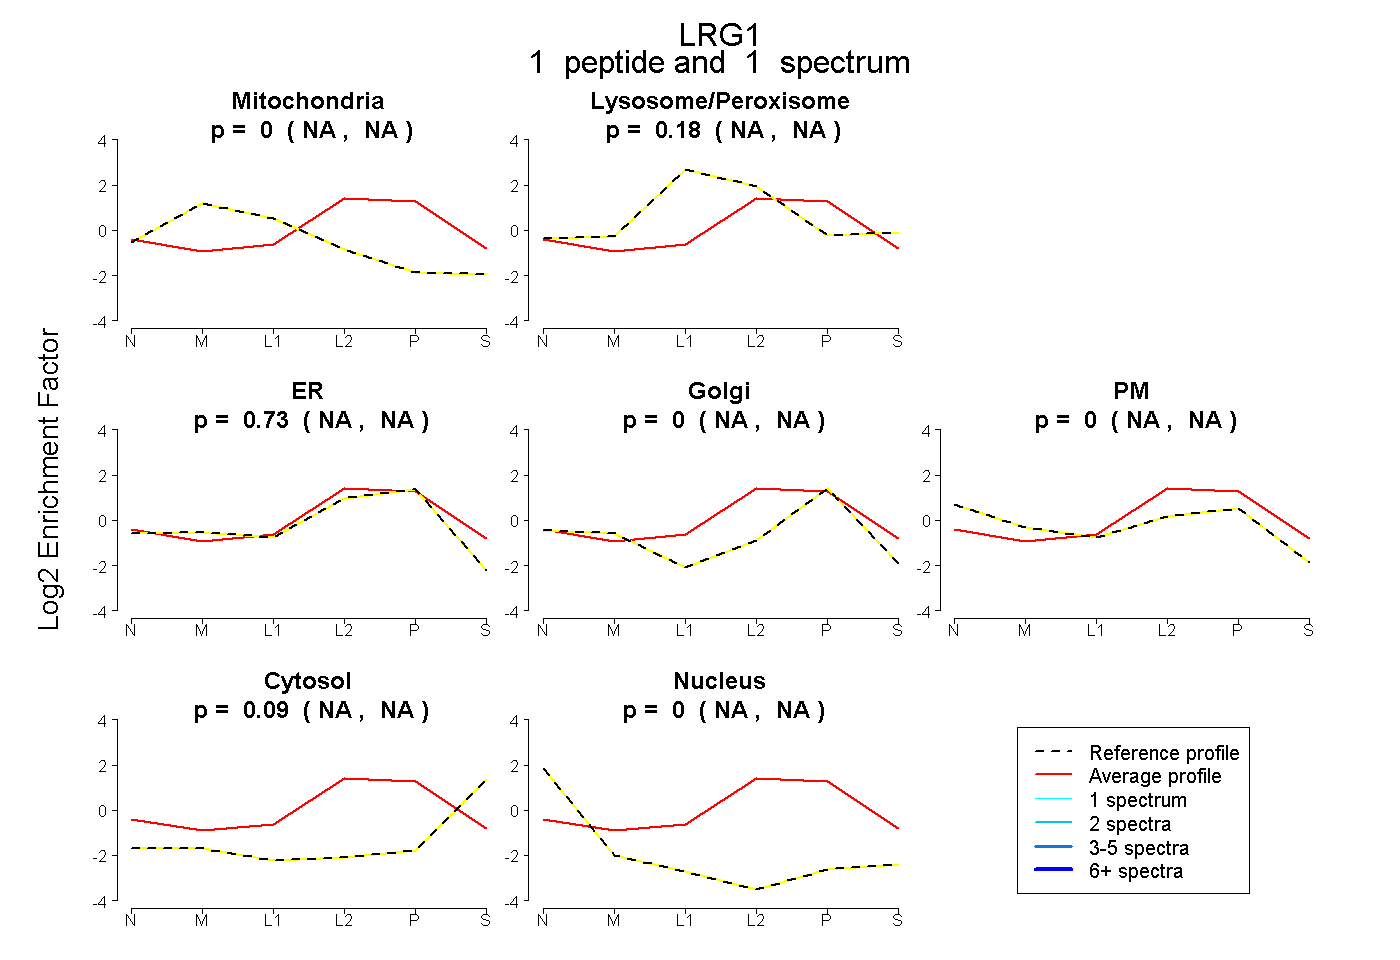 |
0.000 NA | NA |
0.177 NA | NA |
0.732 NA | NA |
0.000 NA | NA |
0.000 NA | NA |
0.091 NA | NA |
0.000 NA | NA |
|||
| Plot | Lyso | Other | |||||||||||
| Expt C |
7 peptides |
18 spectra |
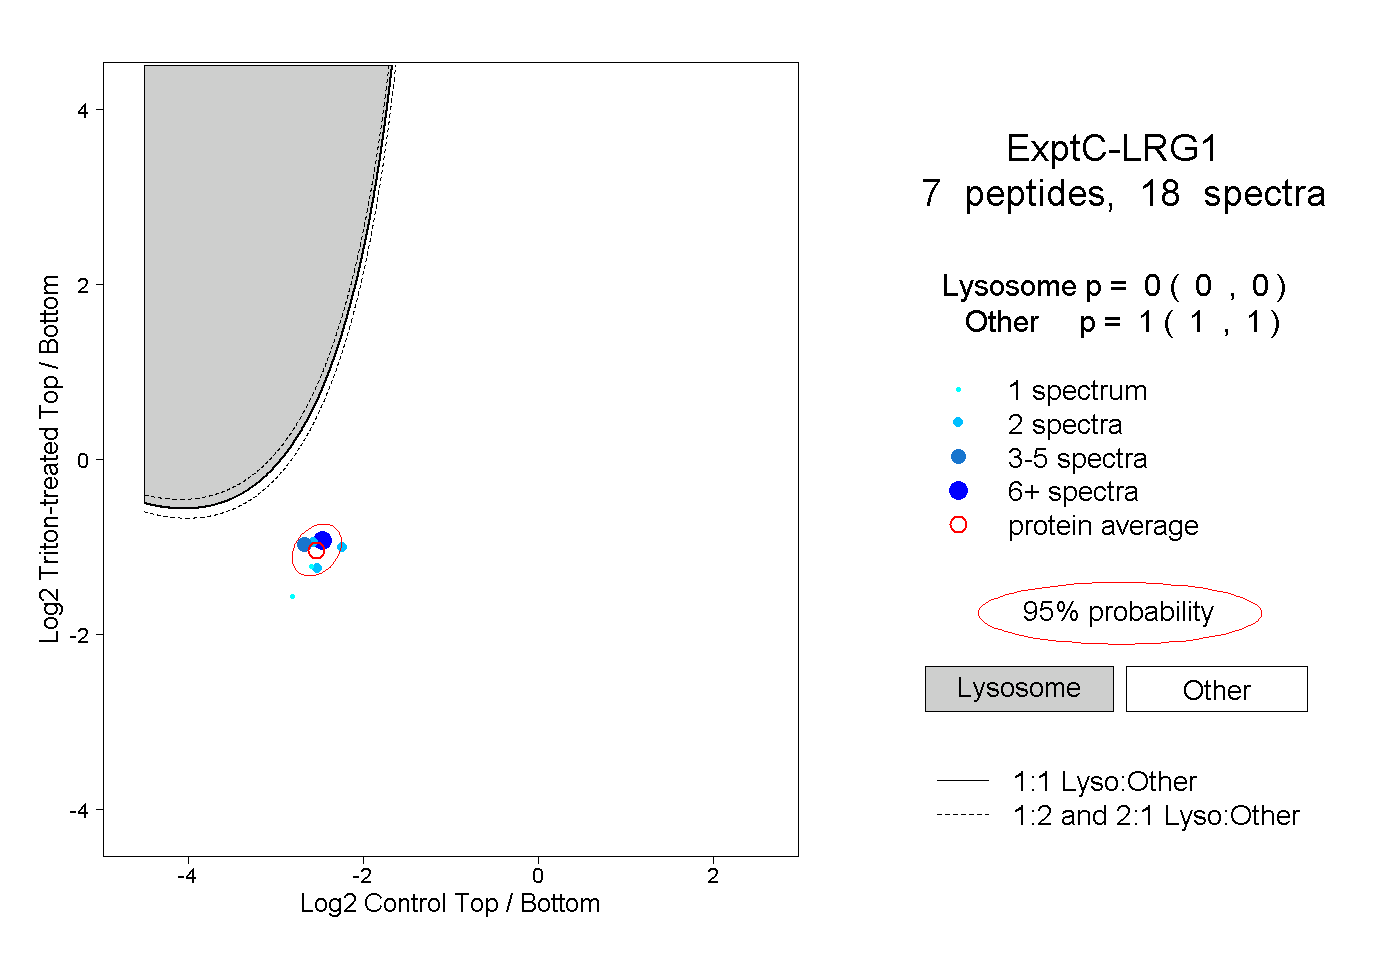 |
0.000 0.000 | 0.000 |
1.000 1.000 | 1.000 |
||||||||
| Plot | Lyso | Other | |||||||||||
| Expt D |
2 peptides |
5 spectra |
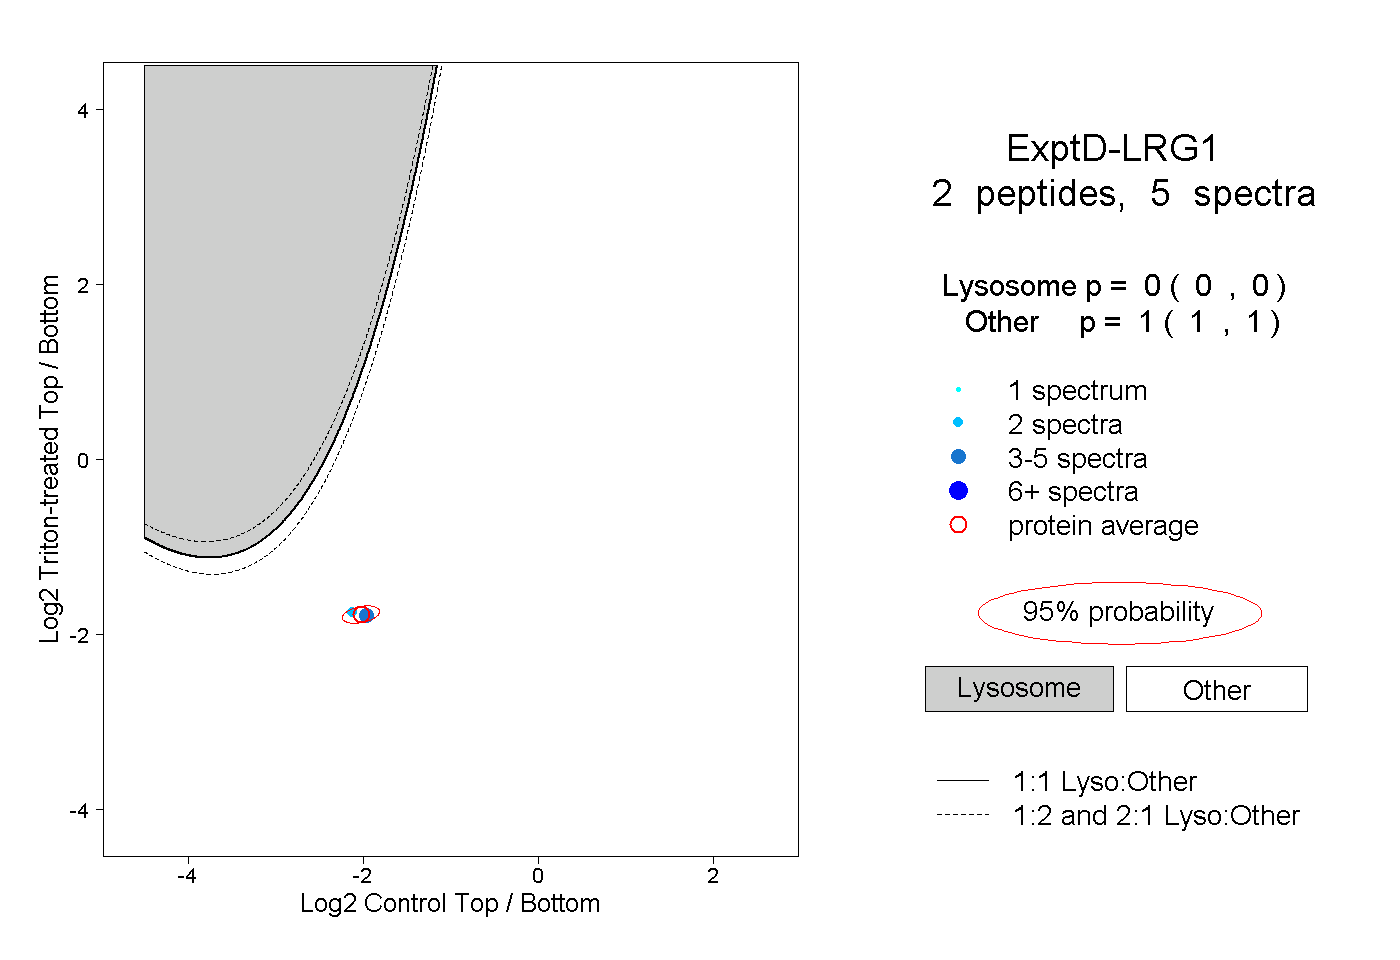 |
0.000 0.000 | 0.000 |
1.000 1.000 | 1.000 |