 1
1peptide
spectra
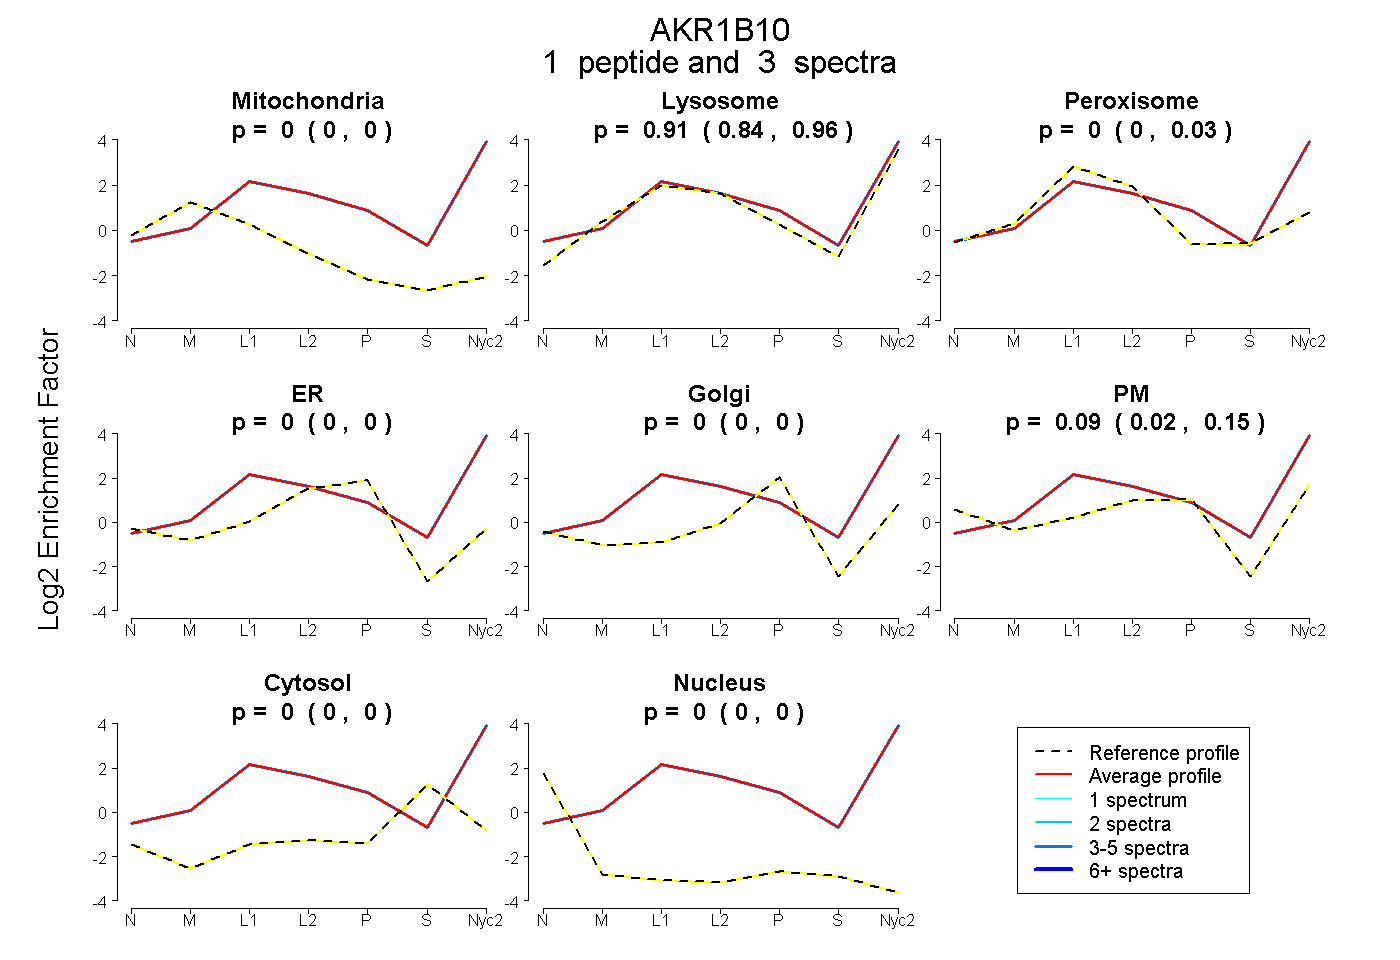
0.000 | 0.000
0.839 | 0.957
0.000 | 0.025
0.000 | 0.000
0.000 | 0.000
0.019 | 0.148
0.000 | 0.000
0.000 | 0.000
1peptide
spectrum
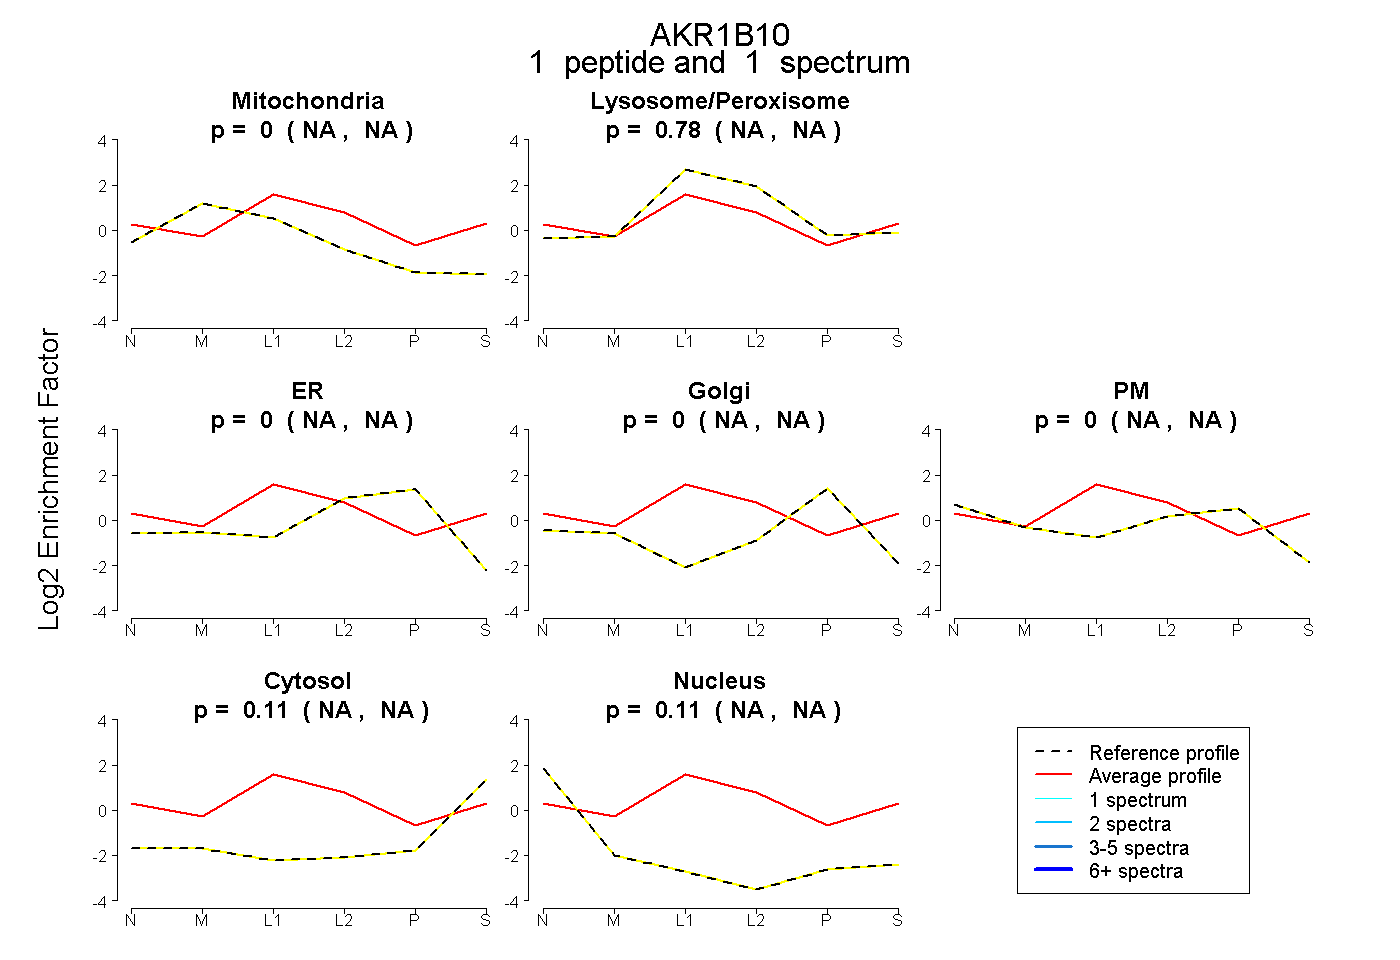
NA | NA
NA | NA
NA | NA
NA | NA
NA | NA
NA | NA
NA | NA
1peptide
spectra
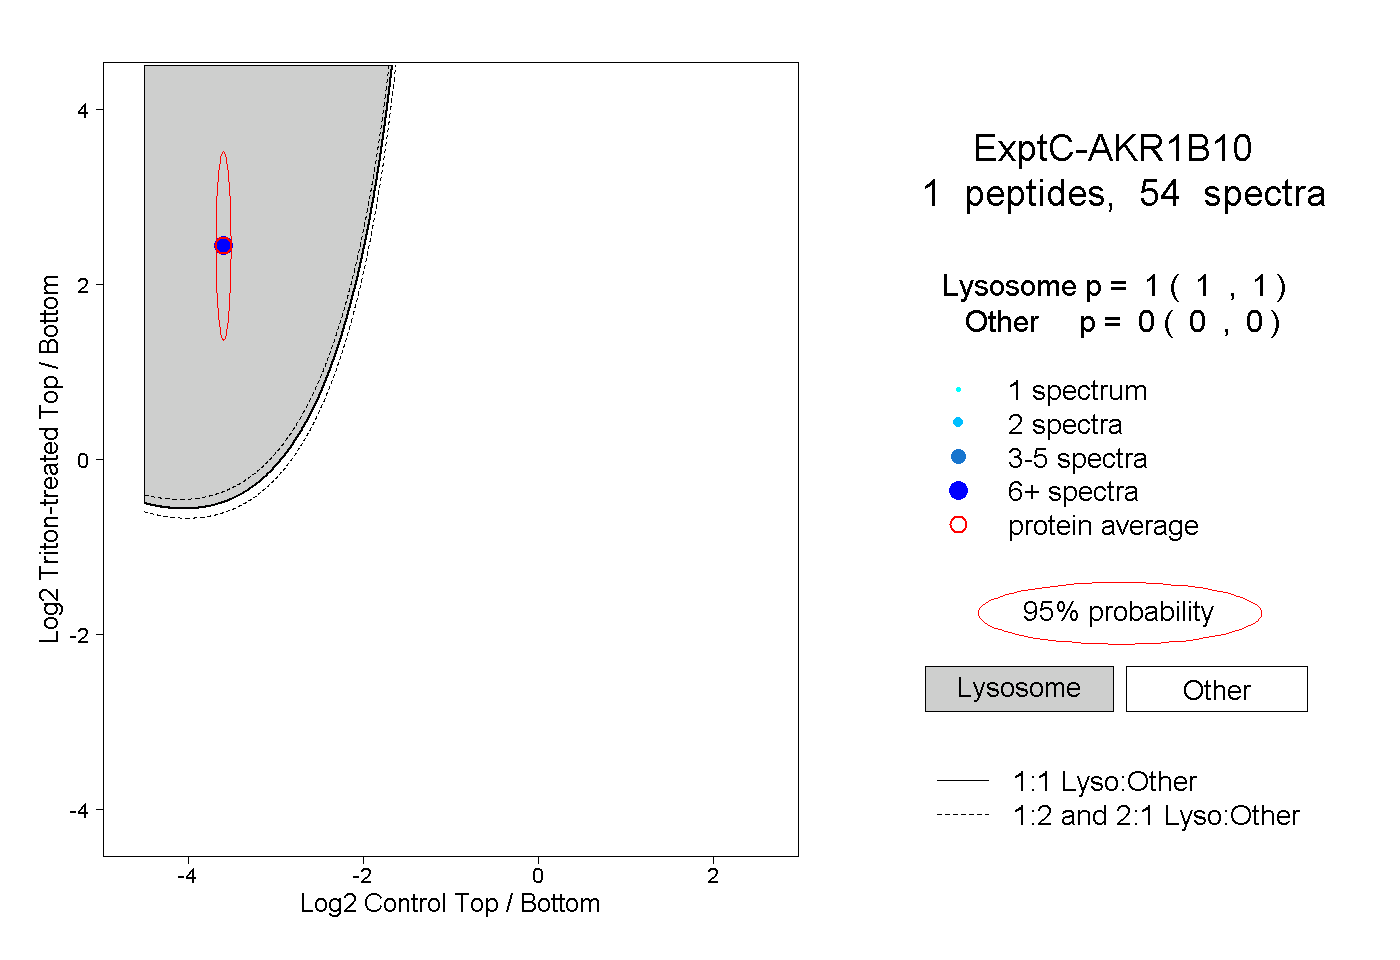
1.000 | 1.000
0.000 | 0.000
2peptides
spectra
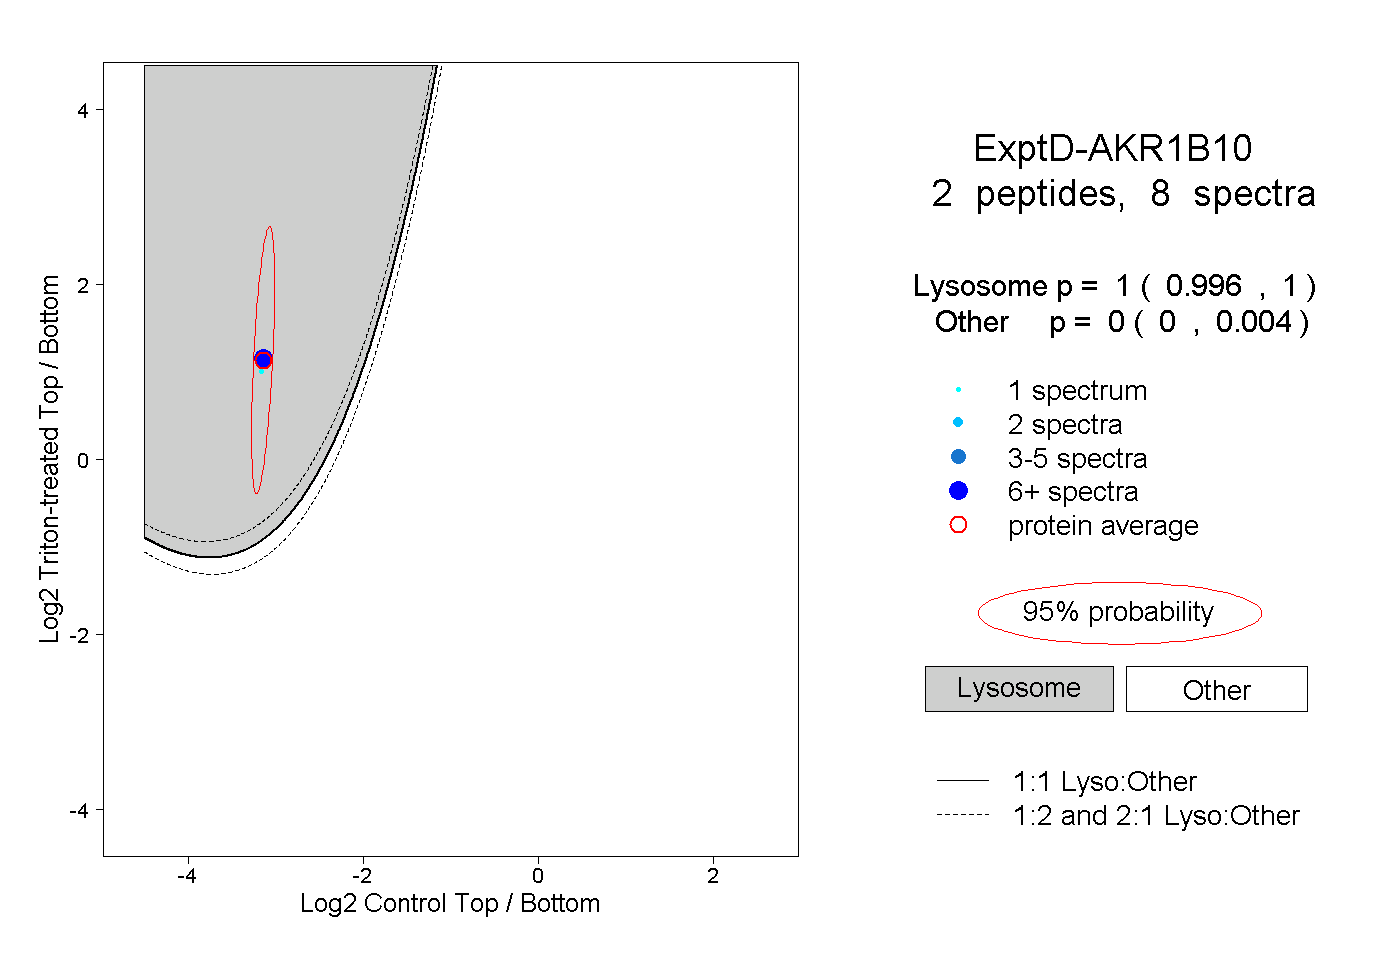
0.996 | 1.000
0.000 | 0.004