 5
5peptides
spectra
0.000 | 0.000
0.000 | 0.000
0.000 | 0.000
0.002 | 0.334
0.000 | 0.348
0.000 | 0.000
0.106 | 0.144
0.469 | 0.553
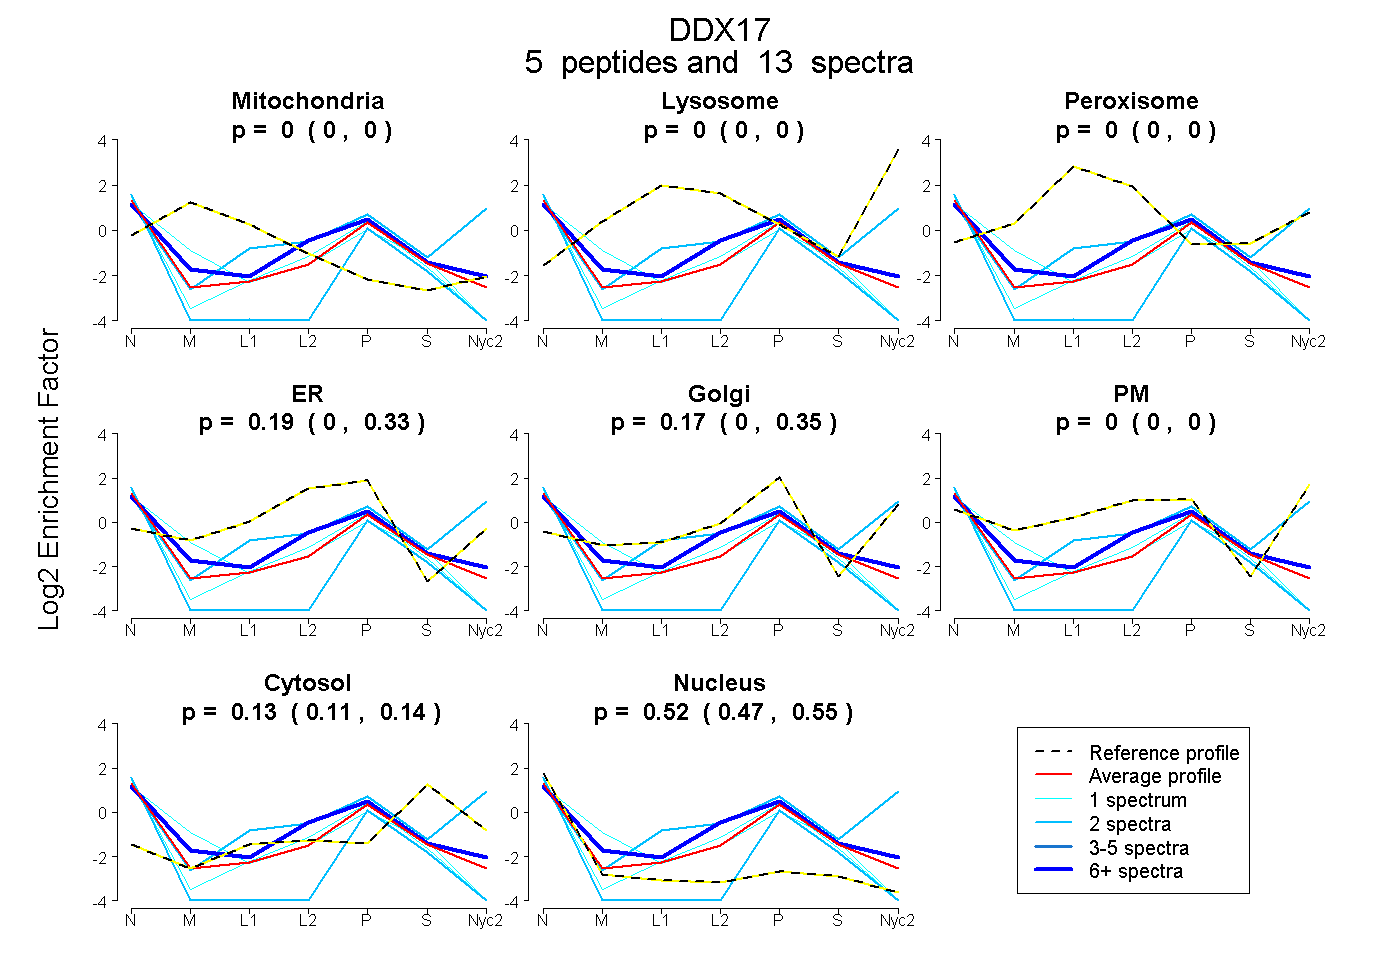
| Plot | Mito | Lyso | Perox | ER | Golgi | PM | Cytosol | Nucleus | |||||
| Expt A |
5 peptides |
13 spectra |
|
0.000 0.000 | 0.000 |
0.000 0.000 | 0.000 |
0.000 0.000 | 0.000 |
0.191 0.002 | 0.334 |
0.167 0.000 | 0.348 |
0.000 0.000 | 0.000 |
0.127 0.106 | 0.144 |
0.515 0.469 | 0.553 |
| 7 spectra, LMQLVDHR | 0.000 | 0.000 | 0.000 | 0.456 | 0.021 | 0.000 | 0.133 | 0.389 | ||
| 2 spectra, DSTSYR | 0.000 | 0.000 | 0.000 | 0.000 | 0.176 | 0.467 | 0.230 | 0.127 | ||
| 1 spectrum, FVINYDYPNSSEDYVHR | 0.065 | 0.000 | 0.000 | 0.296 | 0.000 | 0.000 | 0.073 | 0.566 | ||
| 2 spectra, SSQSSSQQFSGIGR | 0.000 | 0.000 | 0.000 | 0.000 | 0.061 | 0.000 | 0.044 | 0.895 | ||
| 1 spectrum, GTAYTFFTPGNLK | 0.000 | 0.000 | 0.000 | 0.305 | 0.000 | 0.000 | 0.065 | 0.630 |
| Plot | Mito | Lyso or Perox | ER | Golgi | PM | Cytosol | Nucleus | ||||||
| Expt B |
2 peptides |
3 spectra |
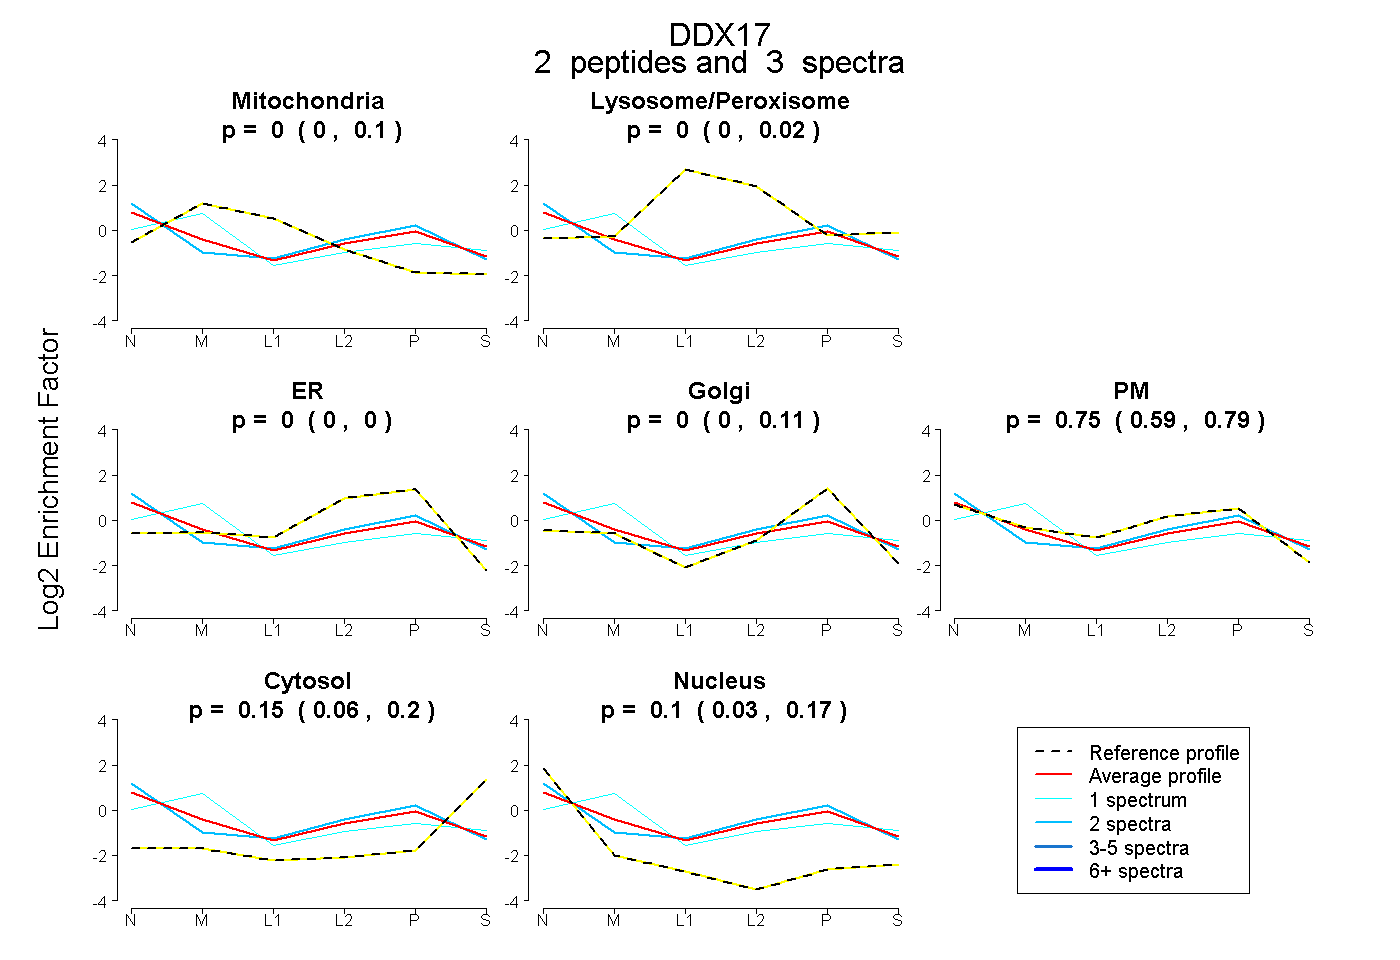 |
0.000 0.000 | 0.097 |
0.000 0.000 | 0.019 |
0.000 0.000 | 0.000 |
0.000 0.000 | 0.107 |
0.753 0.586 | 0.788 |
0.145 0.056 | 0.203 |
0.102 0.028 | 0.167 |
|||
| Plot | Lyso | Other | |||||||||||
| Expt D |
1 peptide |
1 spectrum |
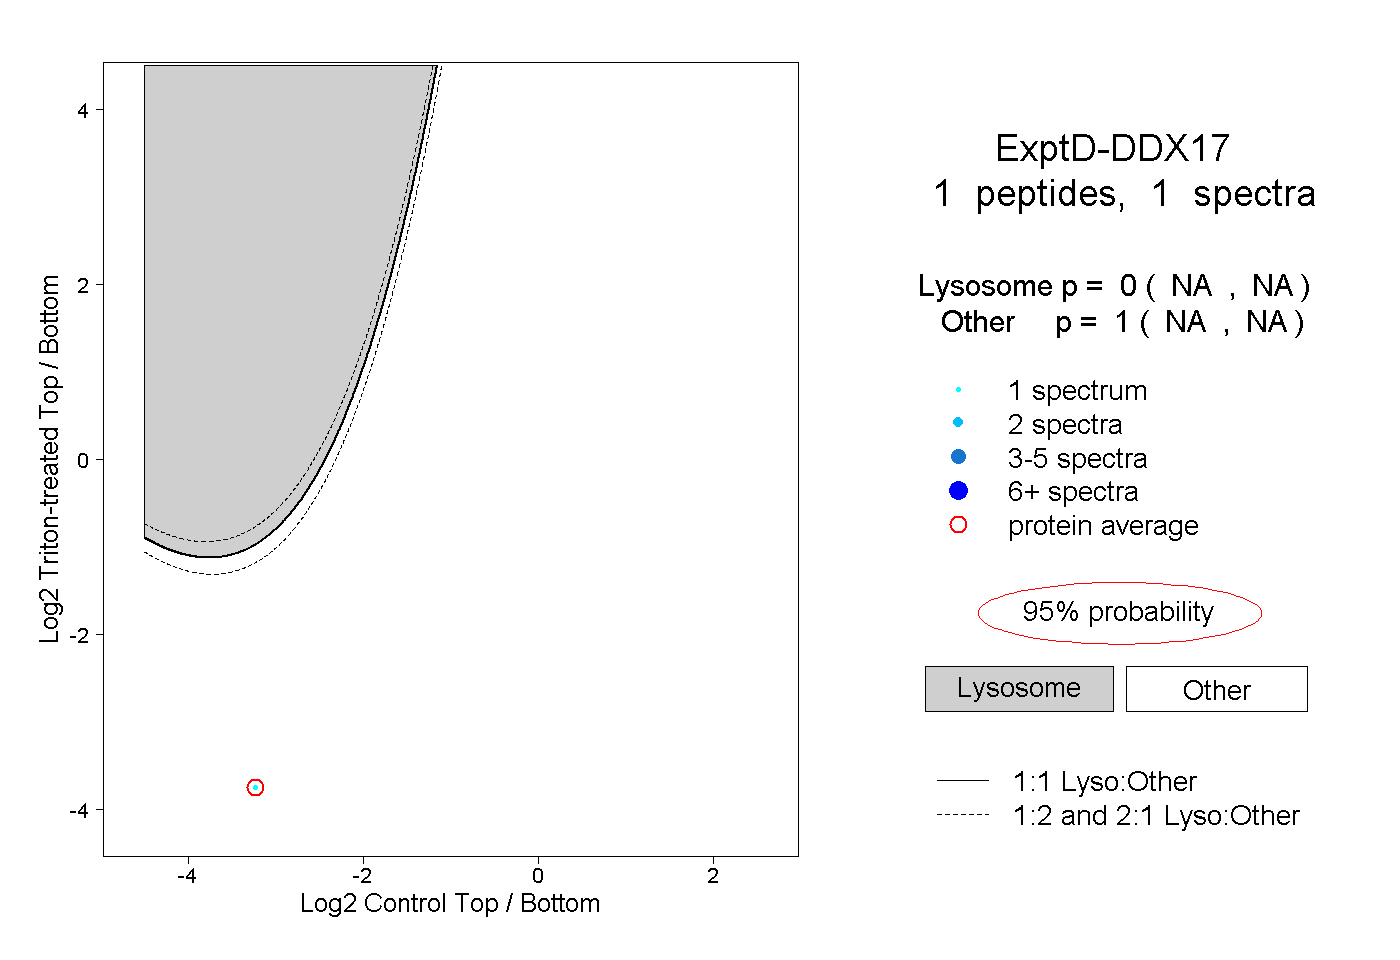 |
0.000 NA | NA |
1.000 NA | NA |