 12
12peptides
spectra
0.000 | 0.000
0.438 | 0.447
0.000 | 0.000
0.000 | 0.014
0.115 | 0.135
0.000 | 0.000
0.421 | 0.428
0.000 | 0.000
| Plot | Mito | Lyso | Perox | ER | Golgi | PM | Cytosol | Nucleus | |||||
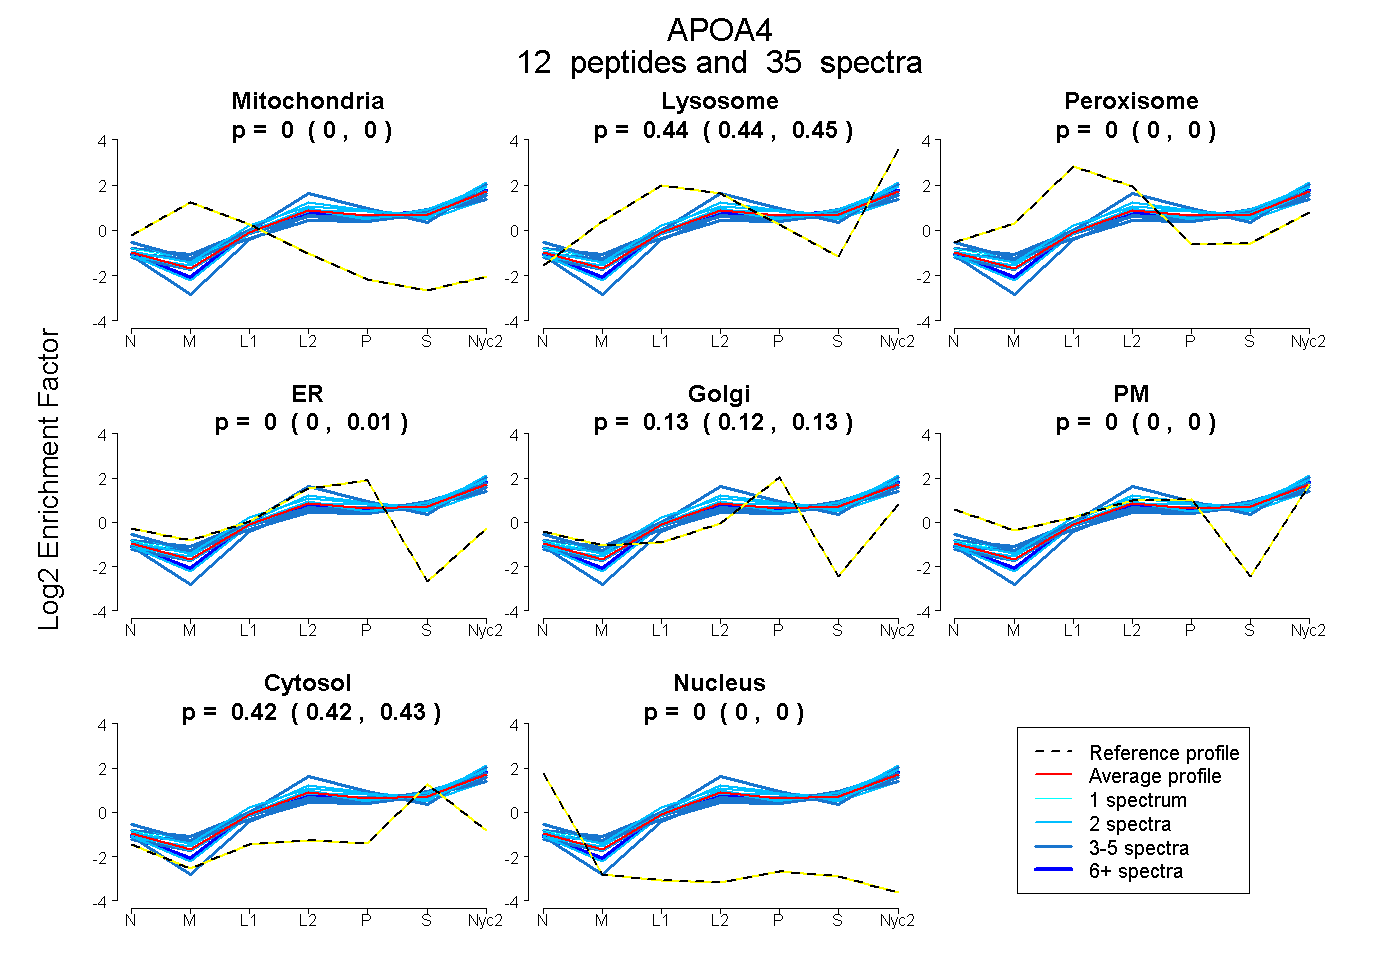
| Expt A |
12 peptides |
35 spectra |
|
0.000 0.000 | 0.000 |
0.443 0.438 | 0.447 |
0.000 0.000 | 0.000 |
0.003 0.000 | 0.014 |
0.129 0.115 | 0.135 |
0.000 0.000 | 0.000 |
0.425 0.421 | 0.428 |
0.000 0.000 | 0.000 |
| 2 spectra, QLDQQVEVFR | 0.000 | 0.457 | 0.000 | 0.000 | 0.061 | 0.000 | 0.481 | 0.000 | ||
| 2 spectra, FNQNMEGLK | 0.000 | 0.516 | 0.000 | 0.000 | 0.128 | 0.000 | 0.356 | 0.000 | ||
| 2 spectra, VSTNIDQLQK | 0.000 | 0.482 | 0.000 | 0.000 | 0.087 | 0.000 | 0.431 | 0.000 | ||
| 1 spectrum, LNHQMEGLAFQMK | 0.000 | 0.457 | 0.000 | 0.000 | 0.182 | 0.000 | 0.362 | 0.000 | ||
| 3 spectra, QLTPYIQR | 0.000 | 0.446 | 0.000 | 0.119 | 0.000 | 0.145 | 0.290 | 0.000 | ||
| 4 spectra, SLEDLNK | 0.000 | 0.394 | 0.000 | 0.000 | 0.127 | 0.000 | 0.479 | 0.000 | ||
| 7 spectra, ATIDQNLEDLR | 0.000 | 0.441 | 0.000 | 0.000 | 0.091 | 0.000 | 0.468 | 0.000 | ||
| 3 spectra, LAPLAEGVQEK | 0.000 | 0.358 | 0.000 | 0.000 | 0.103 | 0.000 | 0.539 | 0.000 | ||
| 4 spectra, EAVEQLQK | 0.000 | 0.422 | 0.000 | 0.000 | 0.121 | 0.000 | 0.457 | 0.000 | ||
| 2 spectra, VSQMFGDNVQK | 0.000 | 0.477 | 0.000 | 0.114 | 0.043 | 0.000 | 0.366 | 0.000 | ||
| 2 spectra, NAEELQTK | 0.000 | 0.316 | 0.000 | 0.089 | 0.024 | 0.174 | 0.397 | 0.000 | ||
| 3 spectra, GNTEGLQK | 0.000 | 0.430 | 0.000 | 0.000 | 0.056 | 0.085 | 0.428 | 0.000 |
| Plot | Mito | Lyso or Perox | ER | Golgi | PM | Cytosol | Nucleus | ||||||
| Expt B |
6 peptides |
14 spectra |
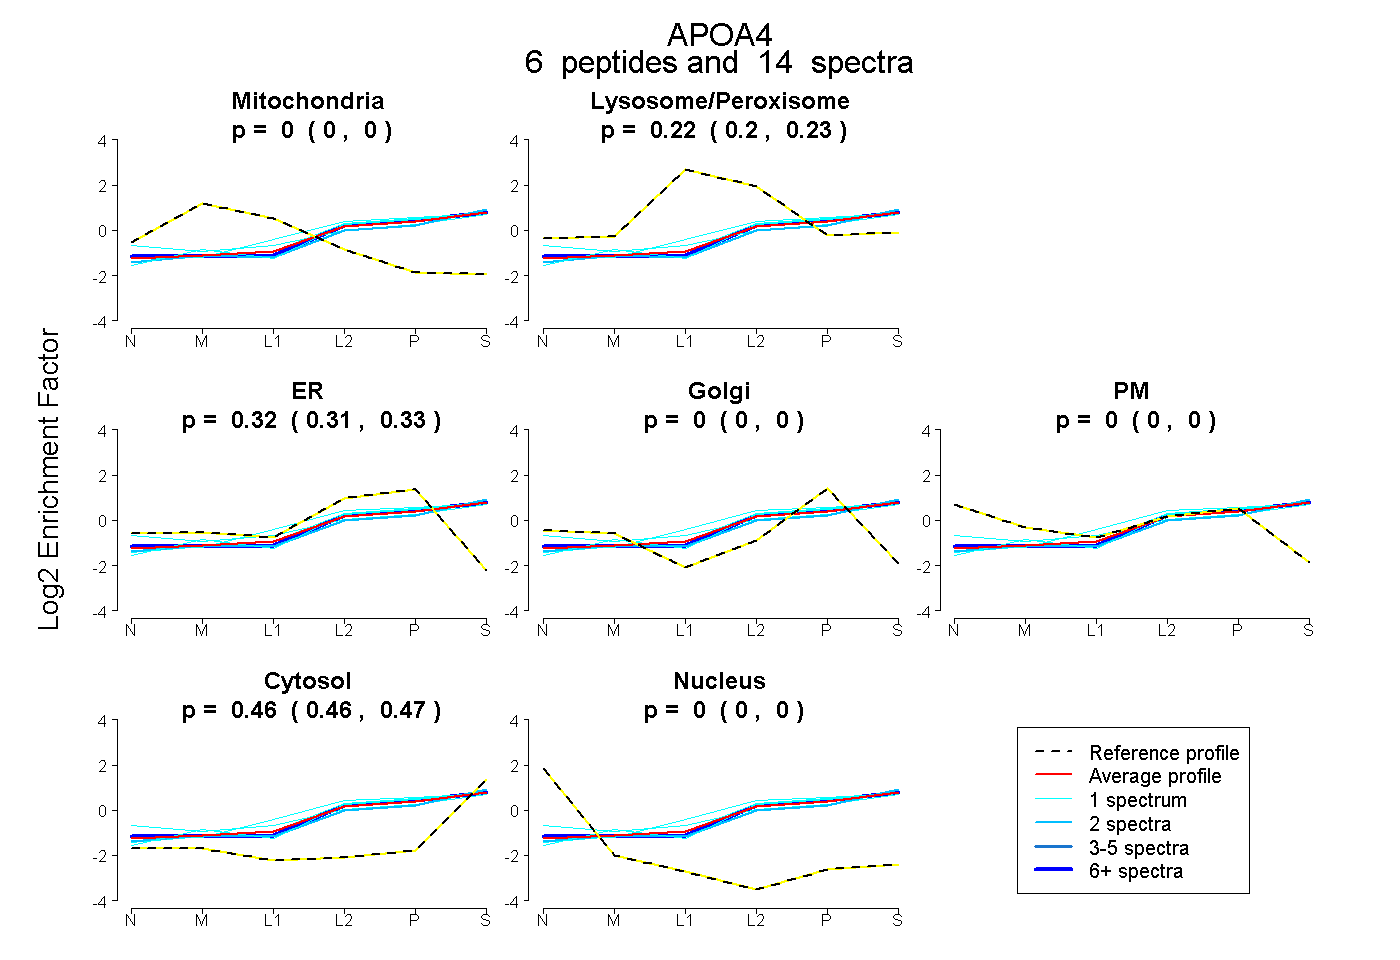 |
0.000 0.000 | 0.000 |
0.218 0.204 | 0.229 |
0.319 0.309 | 0.328 |
0.000 0.000 | 0.000 |
0.000 0.000 | 0.000 |
0.463 0.457 | 0.468 |
0.000 0.000 | 0.000 |
|||
| Plot | Lyso | Other | |||||||||||
| Expt C |
16 peptides |
69 spectra |
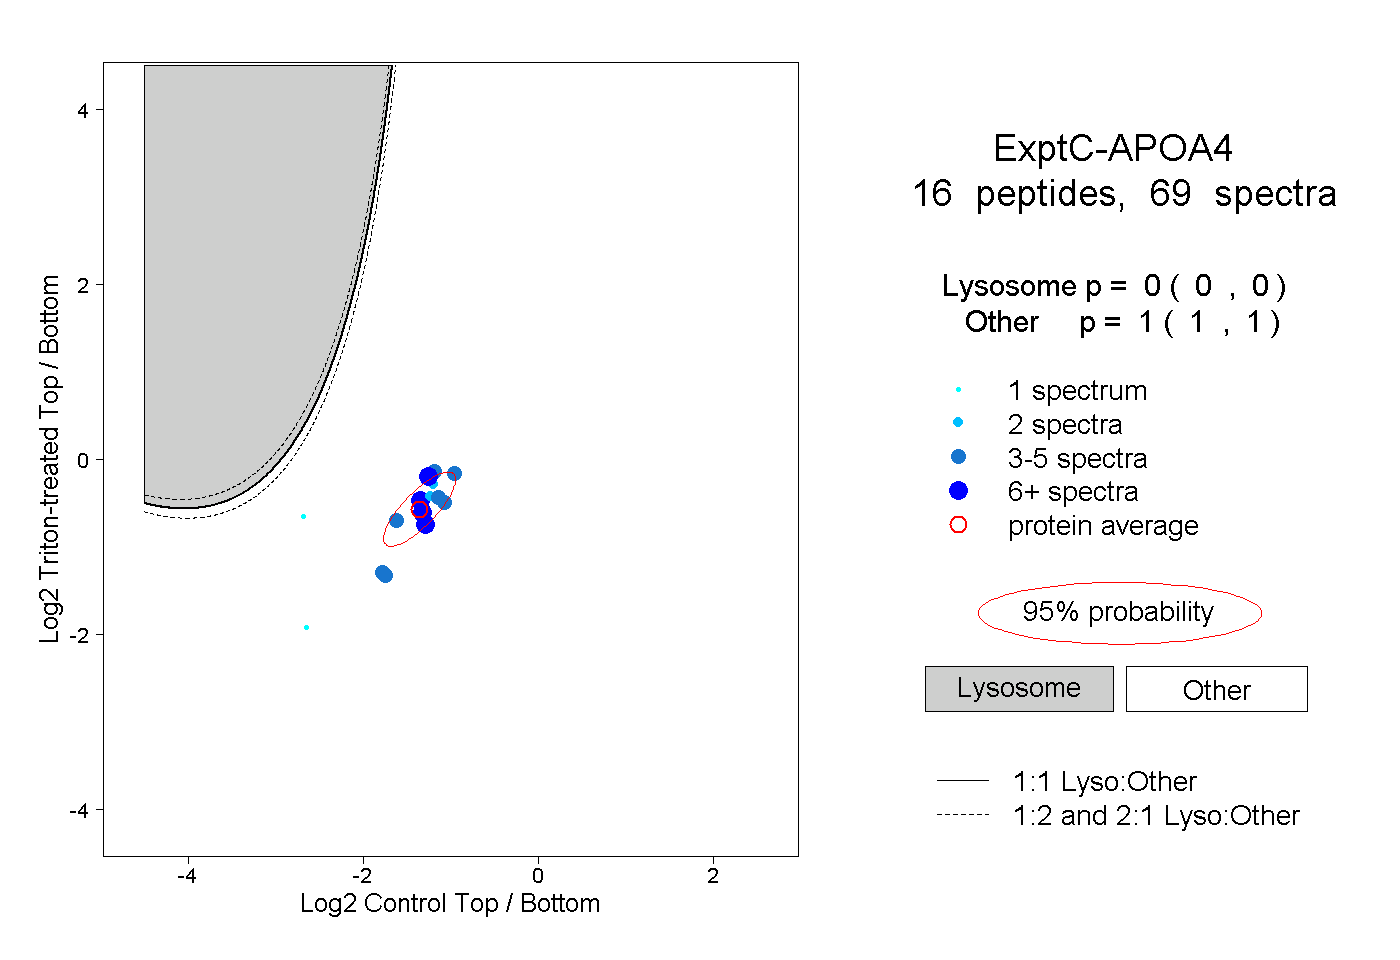 |
0.000 0.000 | 0.000 |
1.000 1.000 | 1.000 |
||||||||
| Plot | Lyso | Other | |||||||||||
| Expt D |
7 peptides |
18 spectra |
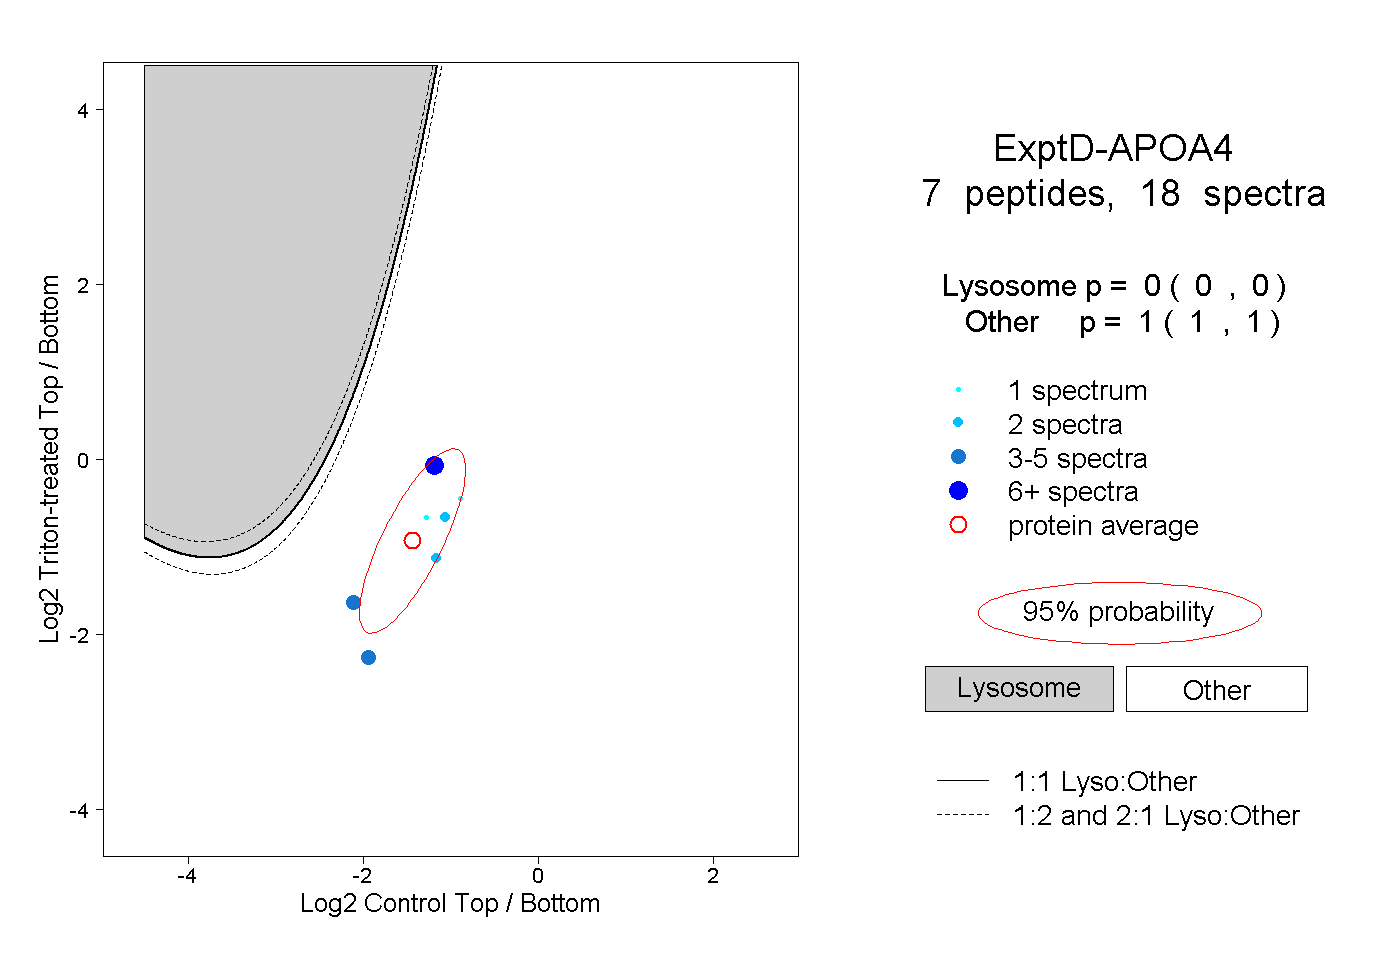 |
0.000 0.000 | 0.000 |
1.000 1.000 | 1.000 |