 12
12peptides
spectra
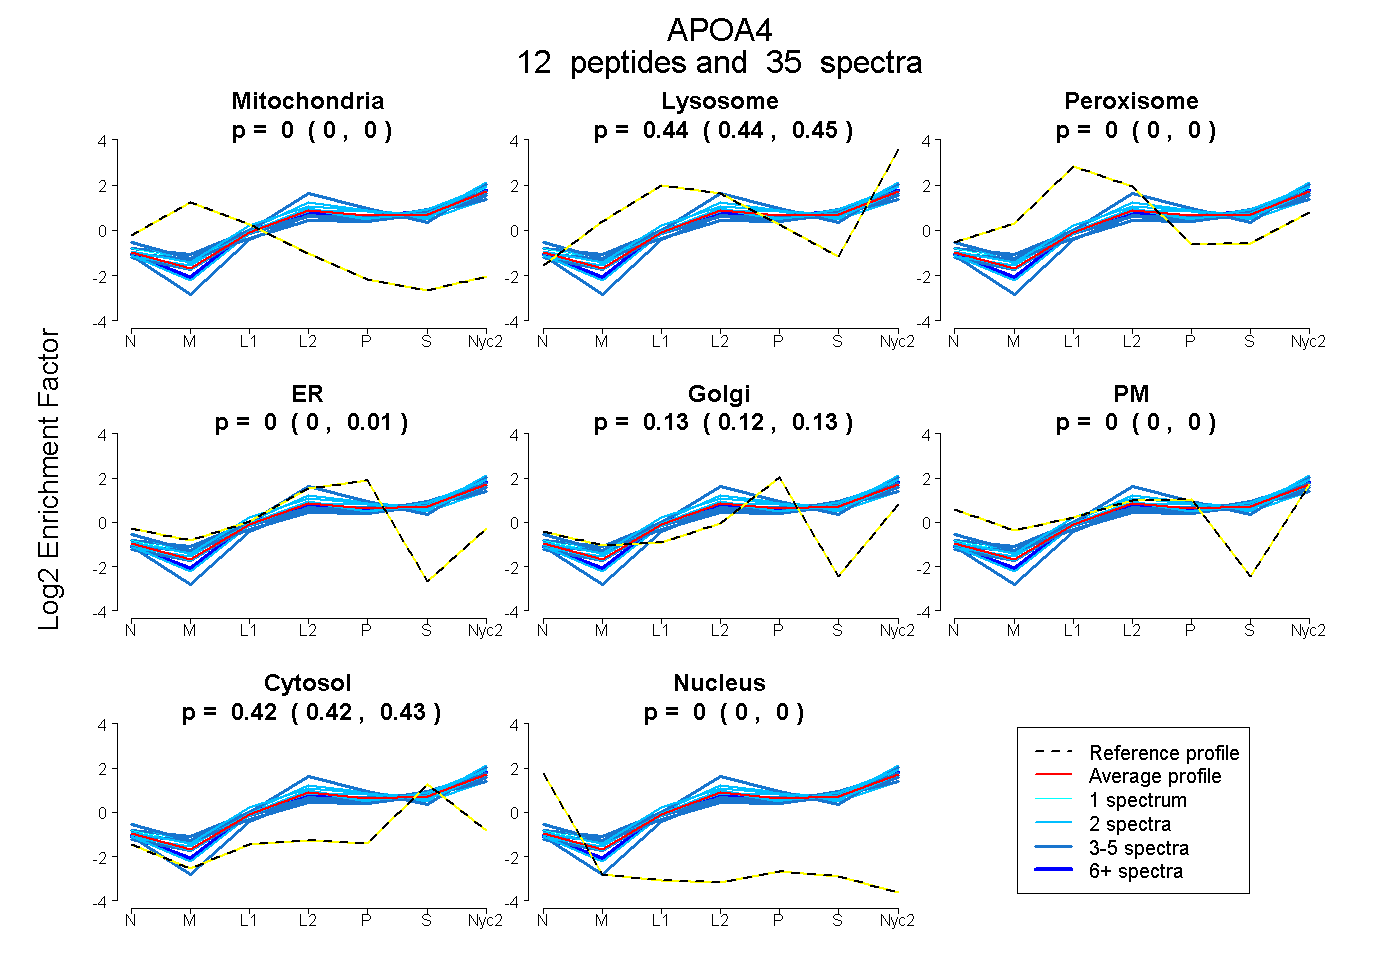
0.000 | 0.000
0.438 | 0.447
0.000 | 0.000
0.000 | 0.014
0.115 | 0.135
0.000 | 0.000
0.421 | 0.428
0.000 | 0.000
6peptides
spectra
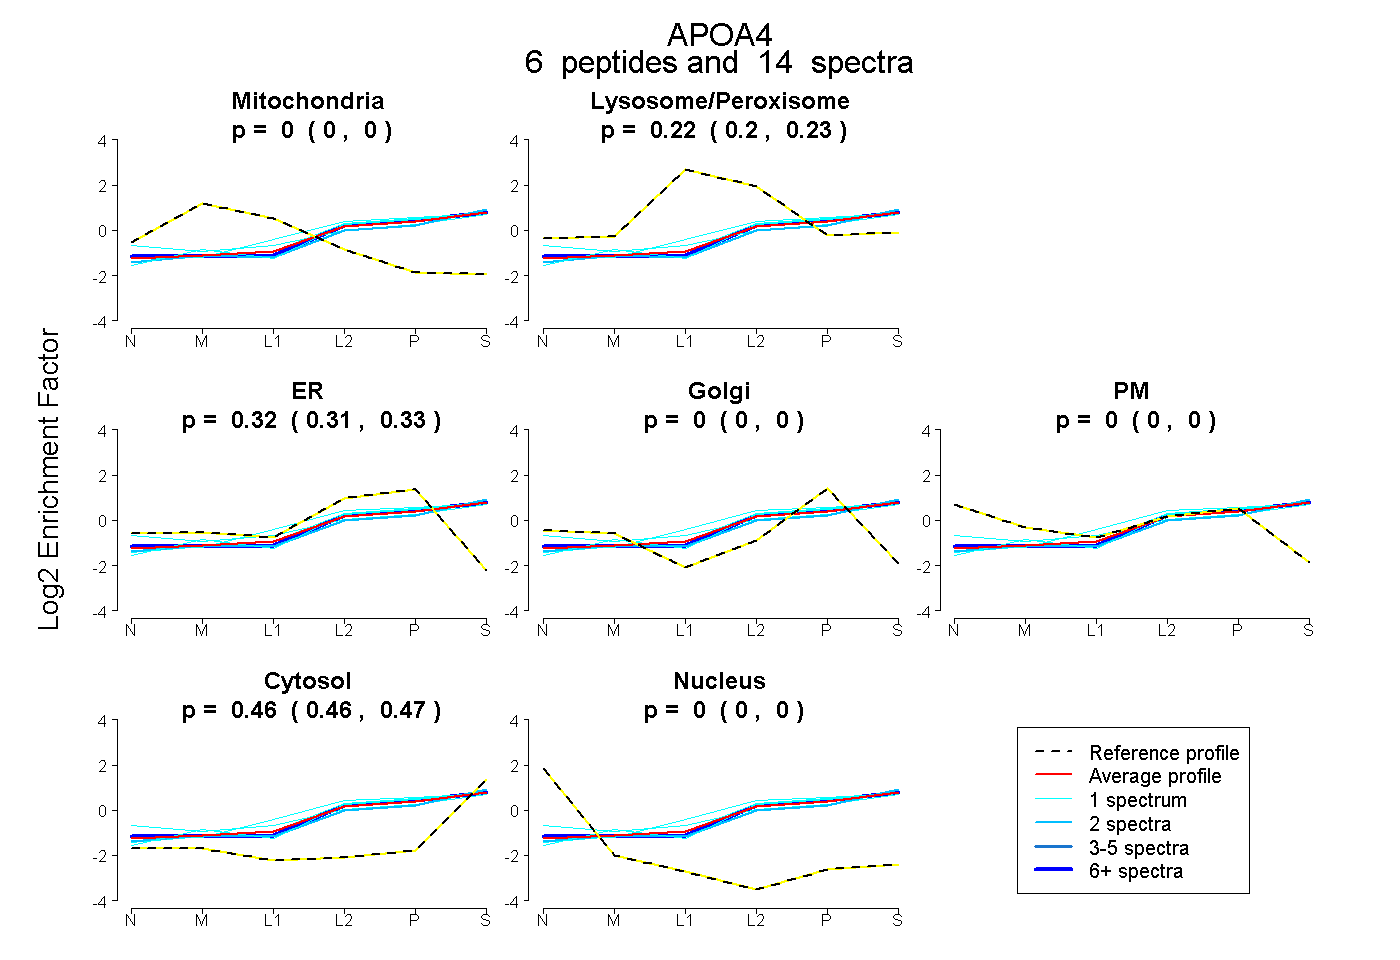
0.000 | 0.000
0.204 | 0.229
0.309 | 0.328
0.000 | 0.000
0.000 | 0.000
0.457 | 0.468
0.000 | 0.000
16peptides
spectra
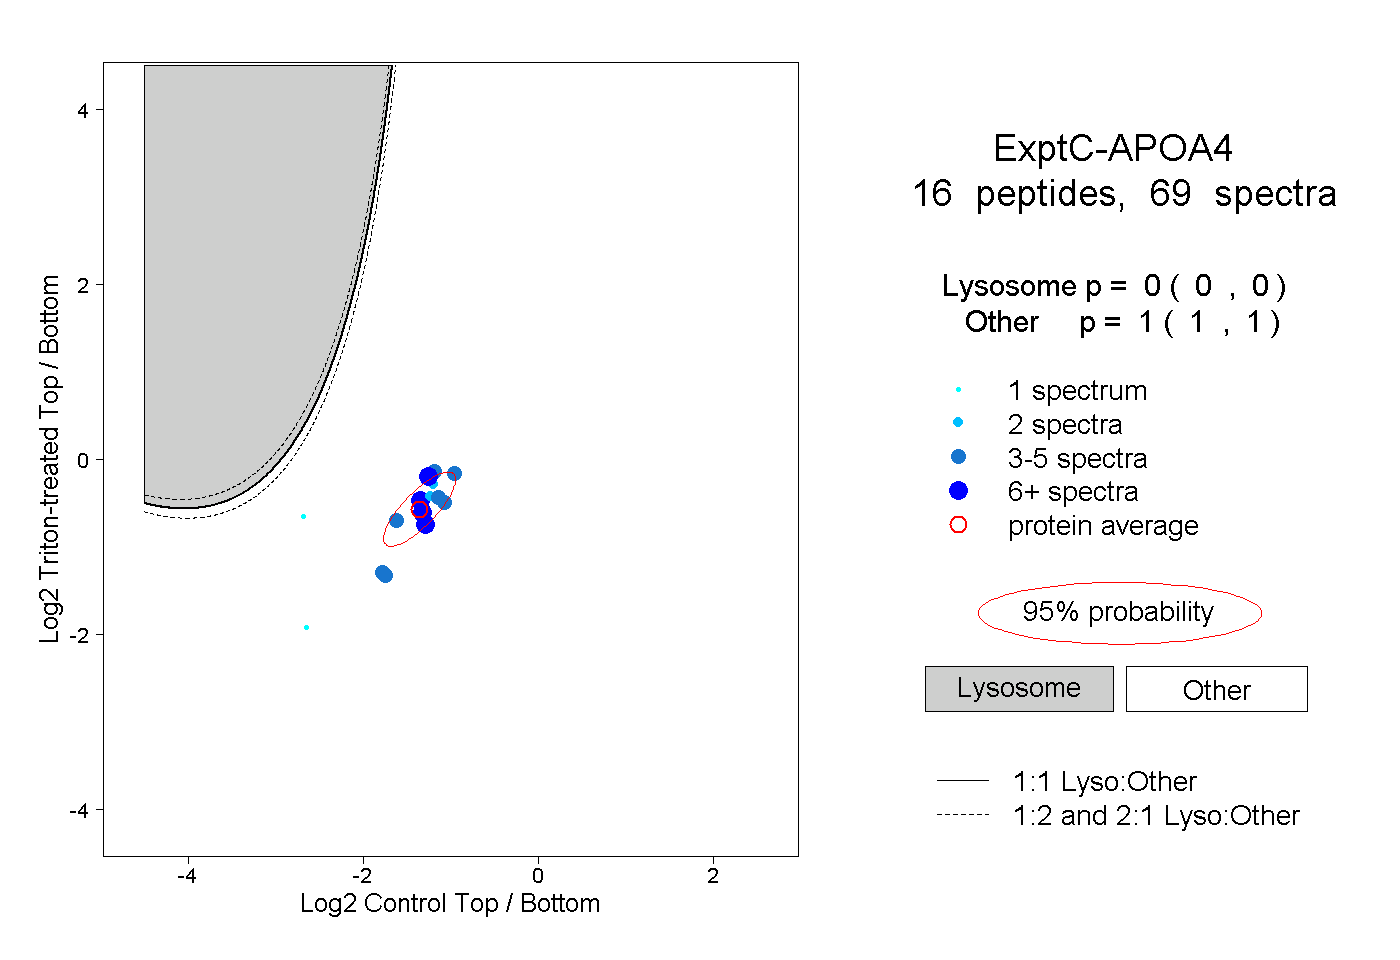
0.000 | 0.000
1.000 | 1.000
7peptides
spectra
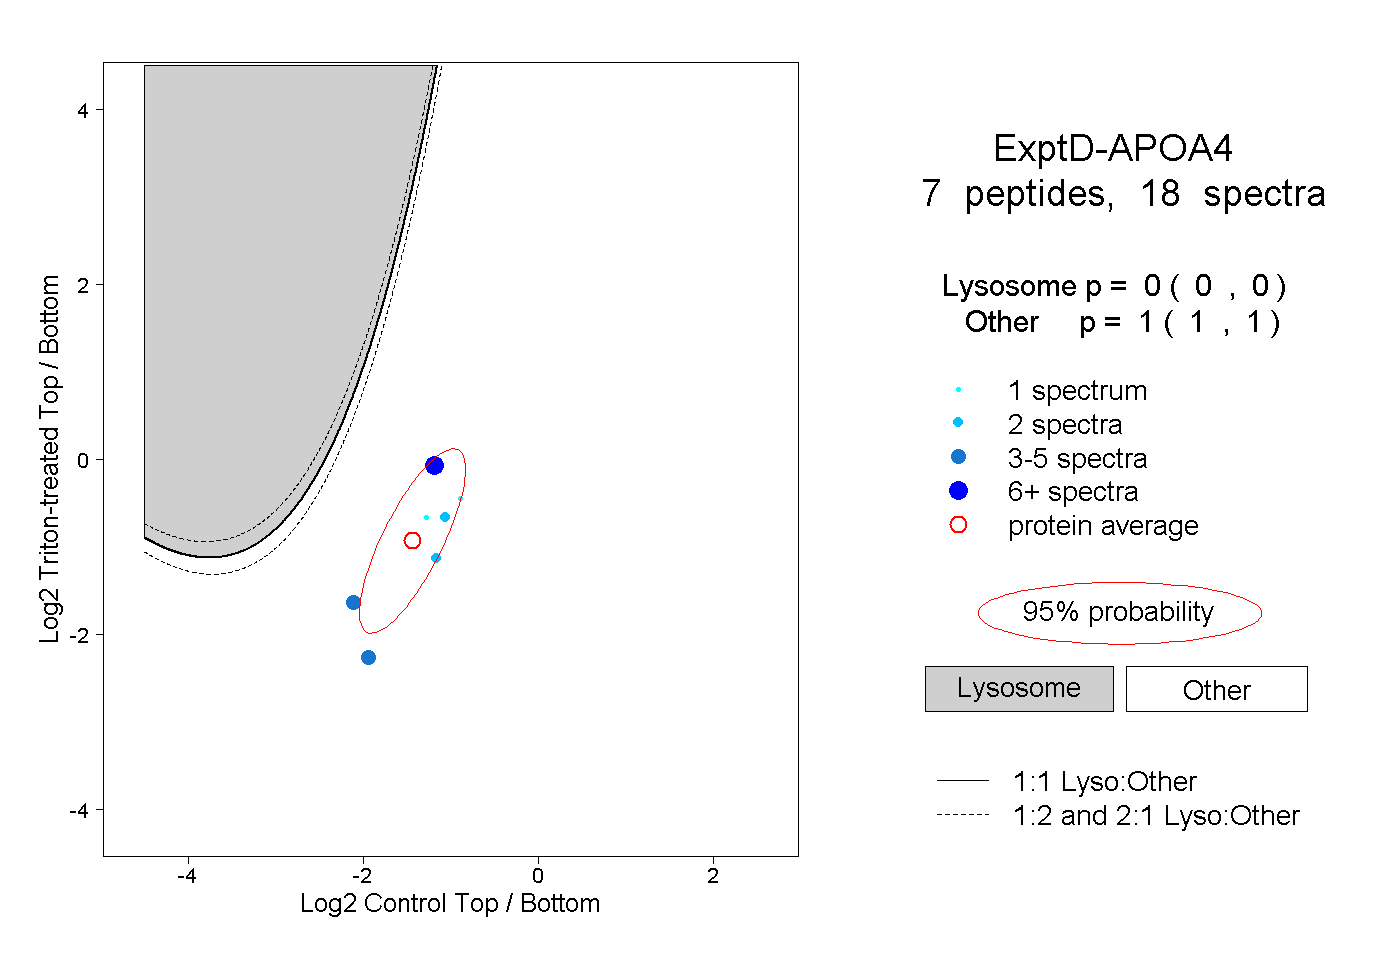
0.000 | 0.000
1.000 | 1.000