37
37peptides
spectra
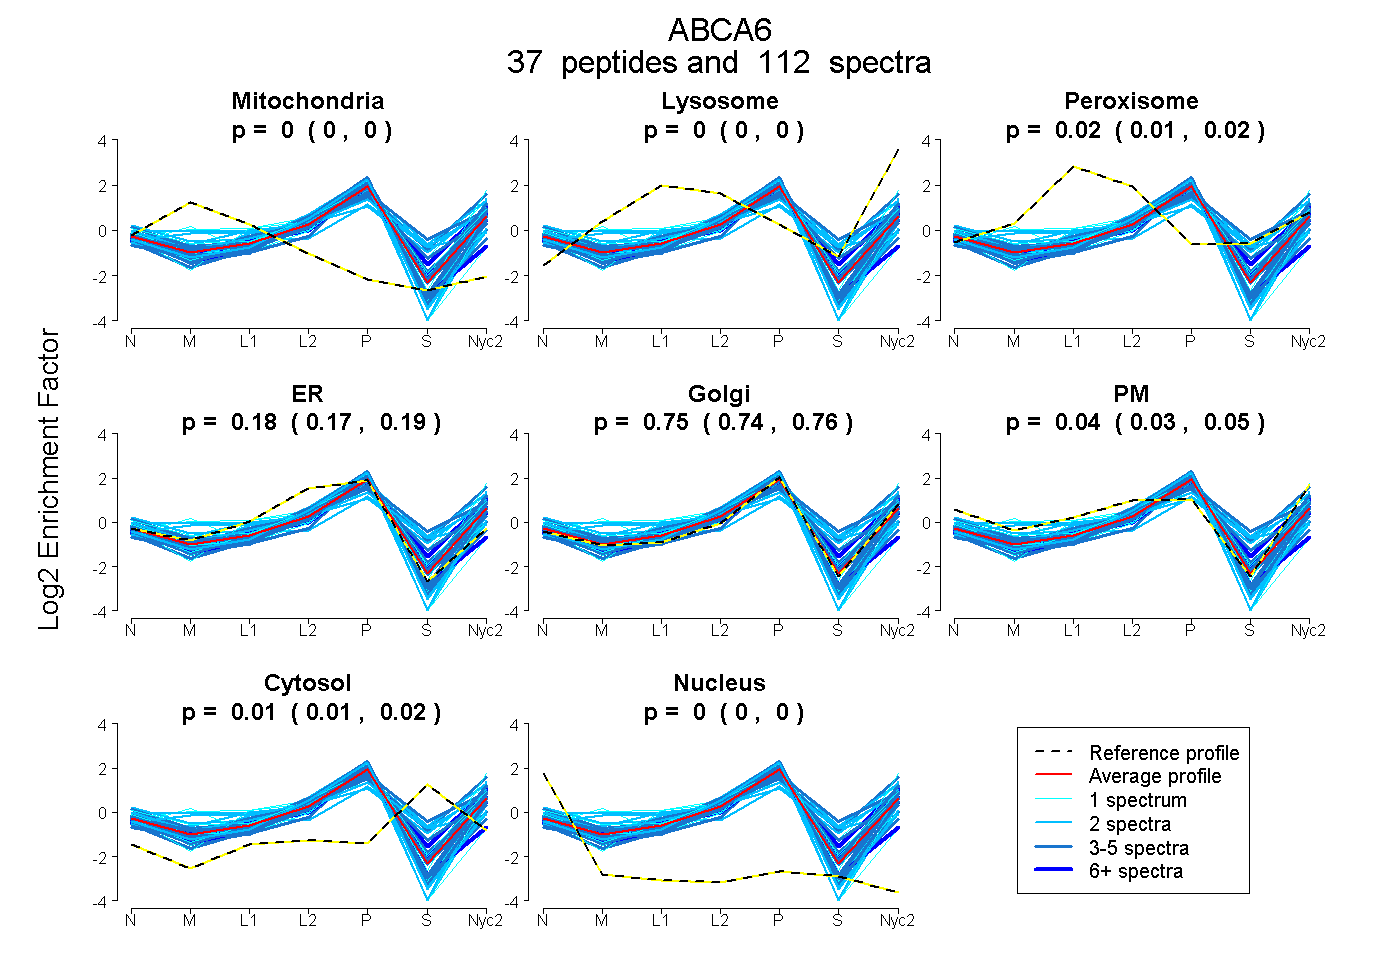
0.000 | 0.000
0.000 | 0.000
0.014 | 0.023
0.171 | 0.188
0.740 | 0.757
0.032 | 0.046
0.009 | 0.015
0.000 | 0.000
10peptides
spectra
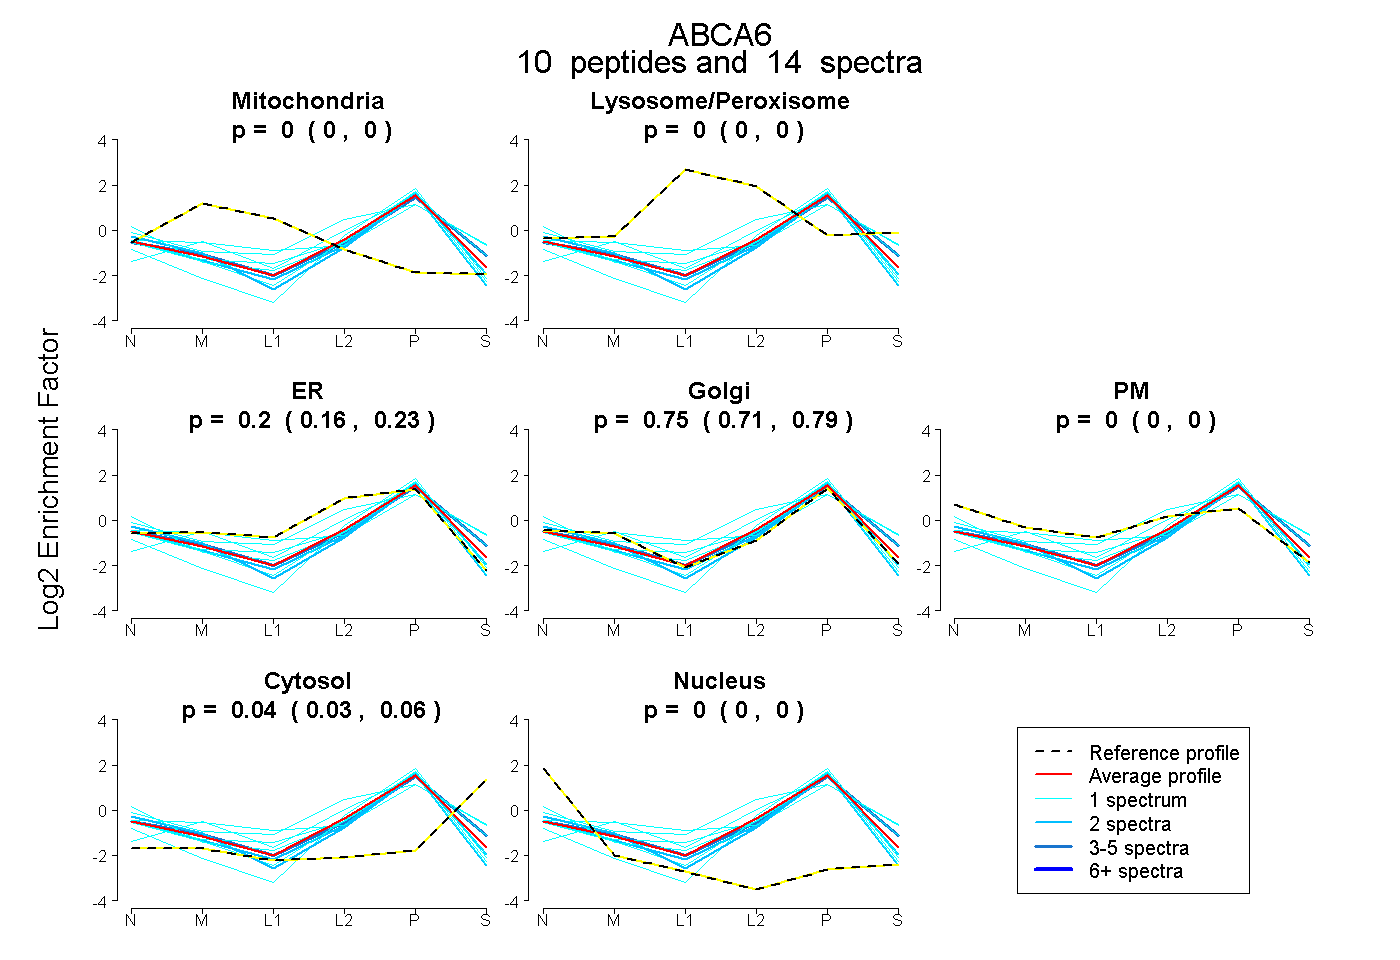
0.000 | 0.000
0.000 | 0.000
0.164 | 0.231
0.709 | 0.790
0.000 | 0.000
0.027 | 0.059
0.000 | 0.000