 5
5peptides
spectra
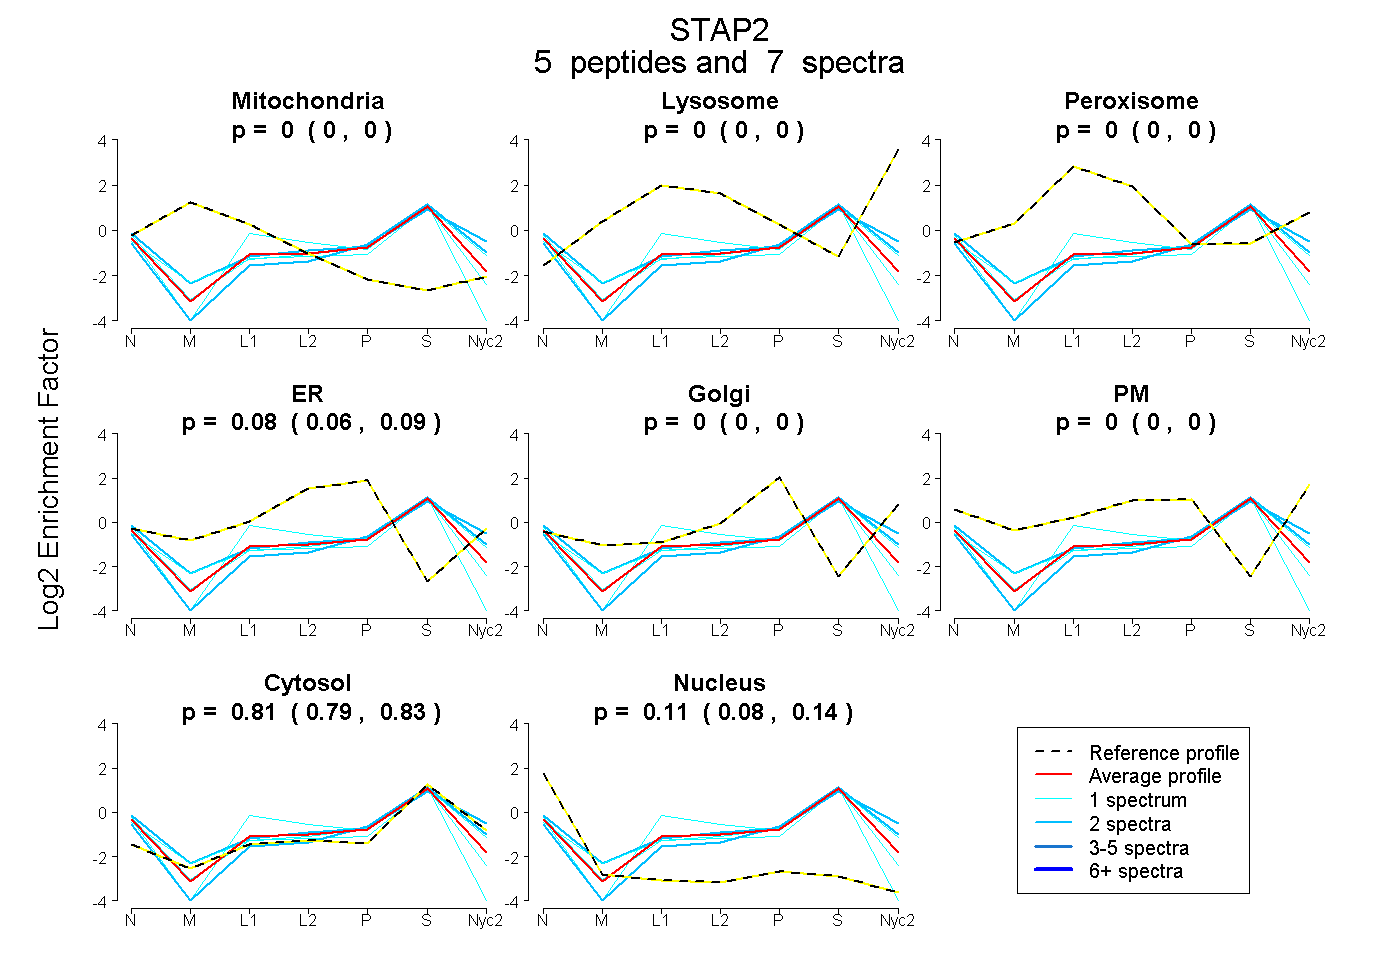
0.000 | 0.000
0.000 | 0.000
0.000 | 0.000
0.055 | 0.093
0.000 | 0.000
0.000 | 0.000
0.788 | 0.834
0.077 | 0.140
| Plot | Mito | Lyso | Perox | ER | Golgi | PM | Cytosol | Nucleus | |||||
| Expt A |
5 peptides |
7 spectra |
|
0.000 0.000 | 0.000 |
0.000 0.000 | 0.000 |
0.000 0.000 | 0.000 |
0.076 0.055 | 0.093 |
0.000 0.000 | 0.000 |
0.000 0.000 | 0.000 |
0.813 0.788 | 0.834 |
0.111 0.077 | 0.140 |
| 2 spectra, GFILTVVELR | 0.000 | 0.000 | 0.000 | 0.000 | 0.024 | 0.000 | 0.900 | 0.077 | ||
| 2 spectra, DSVSVTTR | 0.000 | 0.000 | 0.000 | 0.000 | 0.000 | 0.185 | 0.776 | 0.039 | ||
| 1 spectrum, YPECGNLLLRPGGDGK | 0.000 | 0.000 | 0.007 | 0.109 | 0.000 | 0.000 | 0.826 | 0.058 | ||
| 1 spectrum, GAPPSHYYENFLEK | 0.000 | 0.000 | 0.030 | 0.028 | 0.000 | 0.000 | 0.728 | 0.213 | ||
| 1 spectrum, AAEVPWCFLQVSR | 0.000 | 0.000 | 0.000 | 0.021 | 0.000 | 0.000 | 0.792 | 0.187 |
| Plot | Mito | Lyso or Perox | ER | Golgi | PM | Cytosol | Nucleus | ||||||
| Expt B |
1 peptide |
1 spectrum |
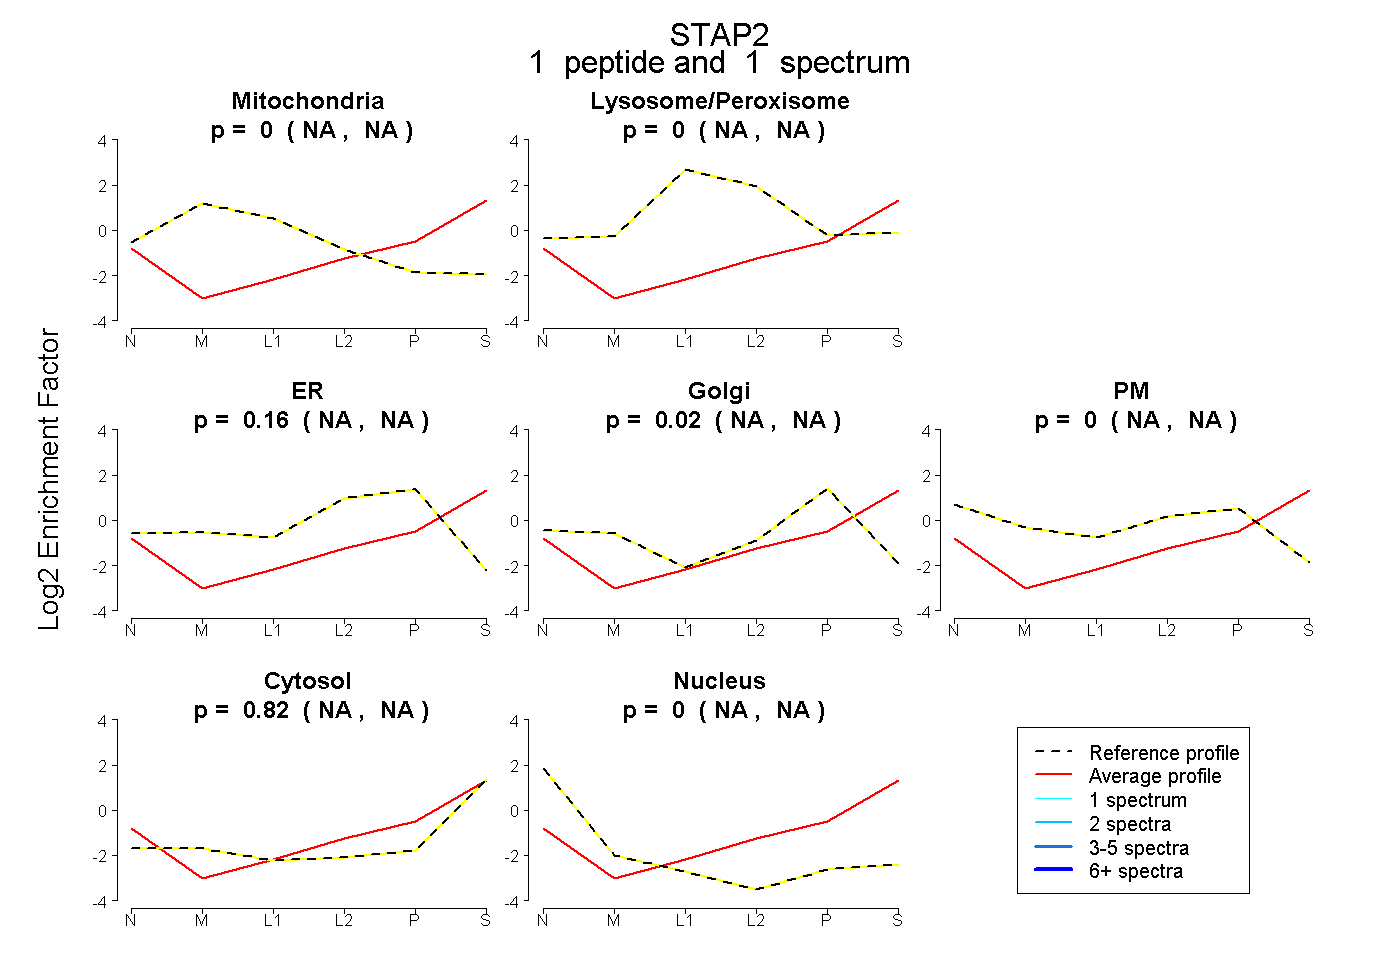 |
0.000 NA | NA |
0.000 NA | NA |
0.157 NA | NA |
0.020 NA | NA |
0.000 NA | NA |
0.824 NA | NA |
0.000 NA | NA |
|||
| Plot | Lyso | Other | |||||||||||
| Expt C |
2 peptides |
3 spectra |
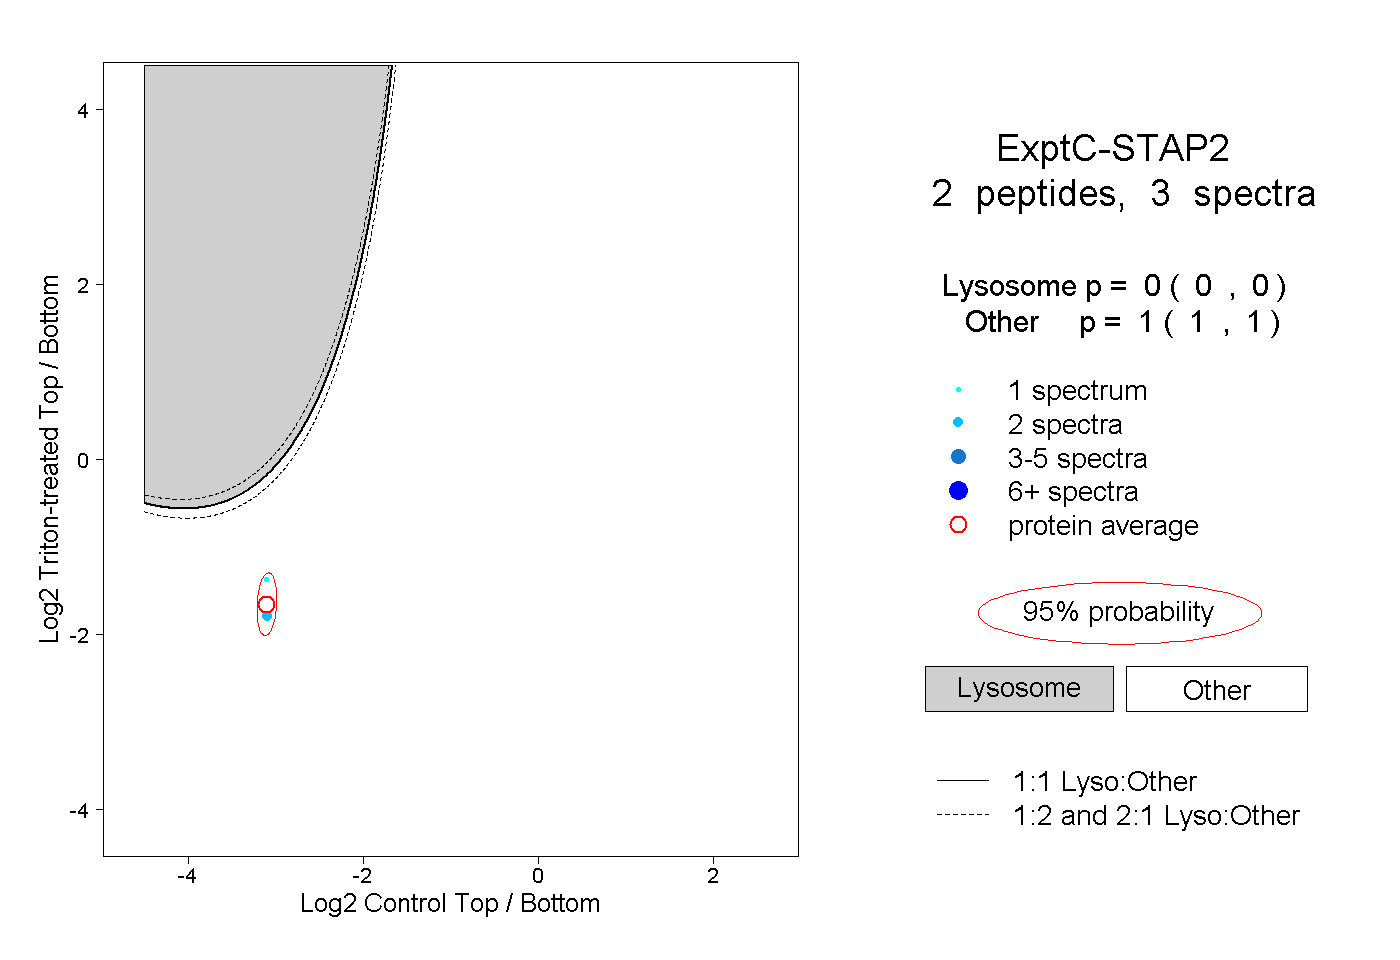 |
0.000 0.000 | 0.000 |
1.000 1.000 | 1.000 |