 1
1peptide
spectra
0.000 | 0.033
0.000 | 0.000
0.000 | 0.000
0.164 | 0.440
0.000 | 0.103
0.000 | 0.029
0.000 | 0.454
0.269 | 0.532
1peptide
spectra
0.000 | 0.000
1.000 | 1.000
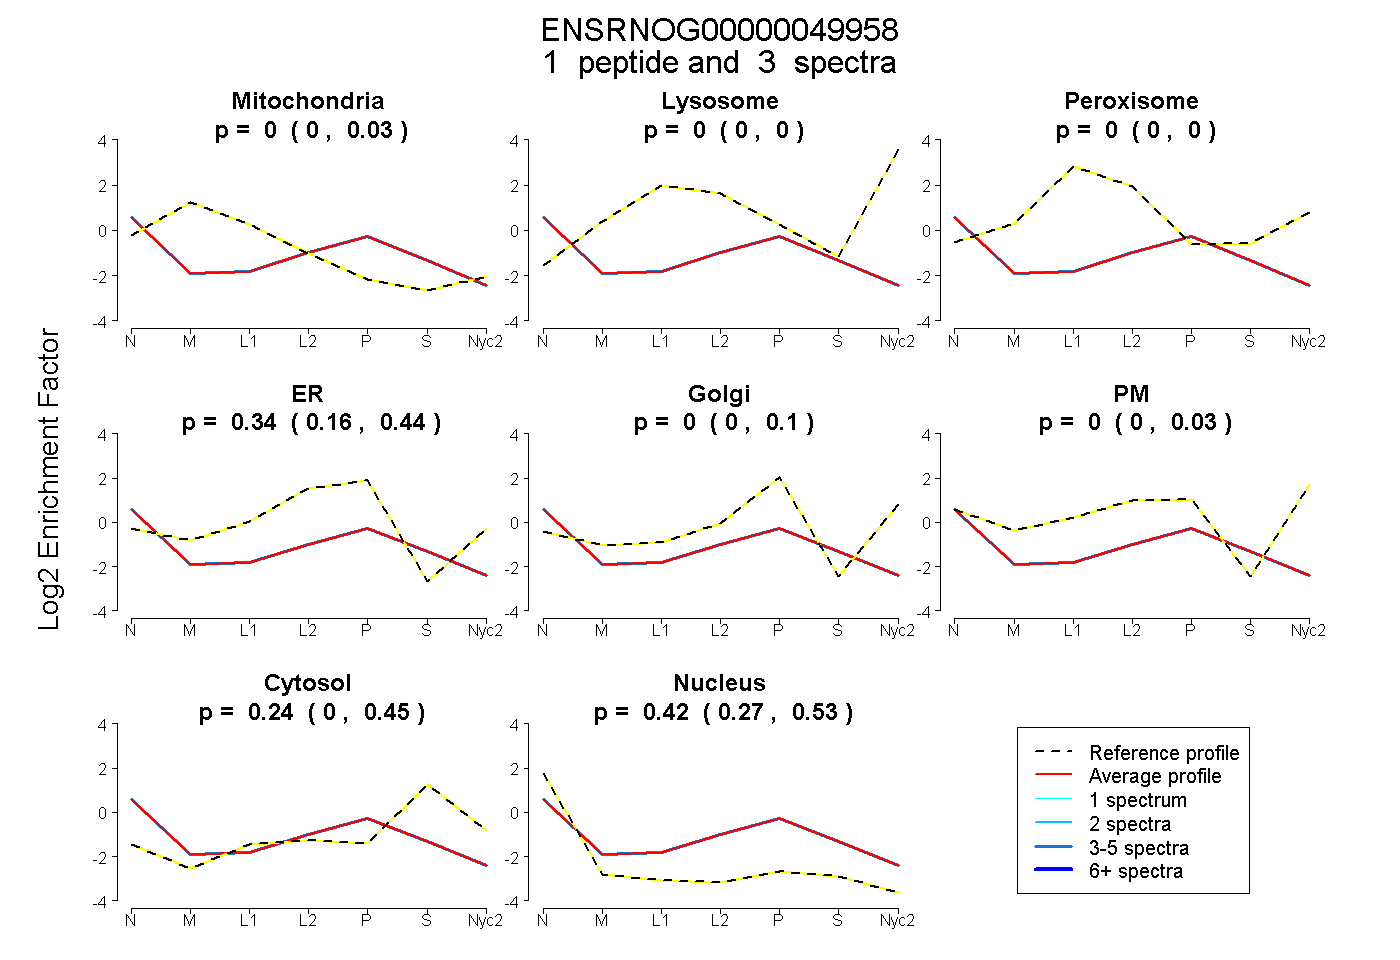
| Plot | Mito | Lyso | Perox | ER | Golgi | PM | Cytosol | Nucleus | |||||
| Expt A |
1 peptide |
3 spectra |
|
0.000 0.000 | 0.033 |
0.000 0.000 | 0.000 |
0.000 0.000 | 0.000 |
0.341 0.164 | 0.440 |
0.000 0.000 | 0.103 |
0.000 0.000 | 0.029 |
0.241 0.000 | 0.454 |
0.418 0.269 | 0.532 |
||
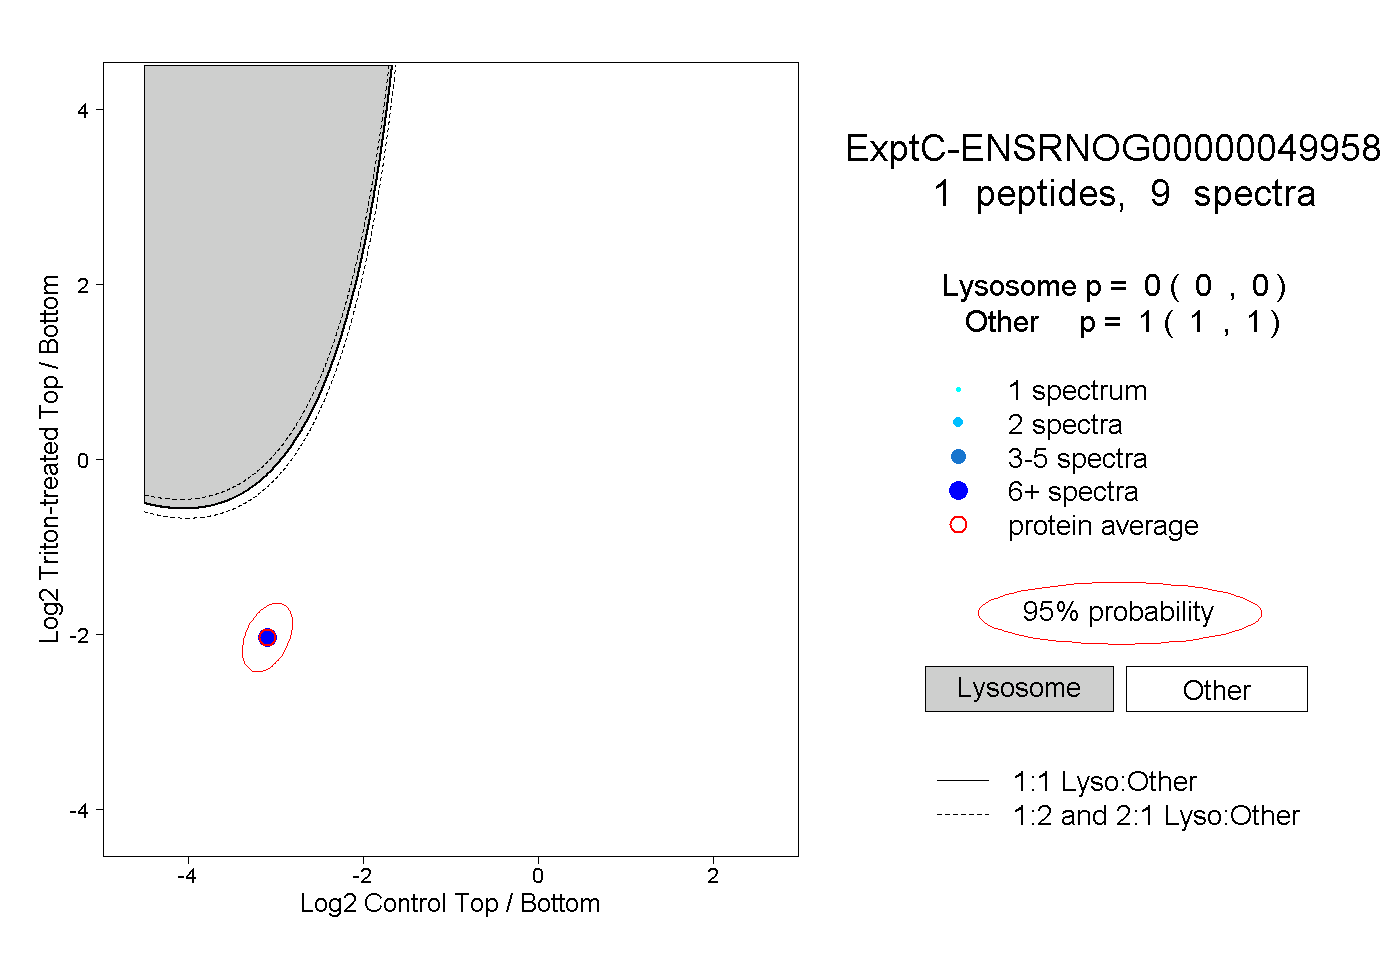
| Plot | Lyso | Other | |||||||||||
| Expt C |
1 peptide |
9 spectra |
|
0.000 0.000 | 0.000 |
1.000 1.000 | 1.000 |