 2
2peptides
spectra
0.000 | 0.000
0.000 | 0.000
0.000 | 0.000
0.762 | 0.932
0.000 | 0.061
0.000 | 0.000
0.000 | 0.062
0.023 | 0.187
2peptides
spectra
NA | NA
NA | NA
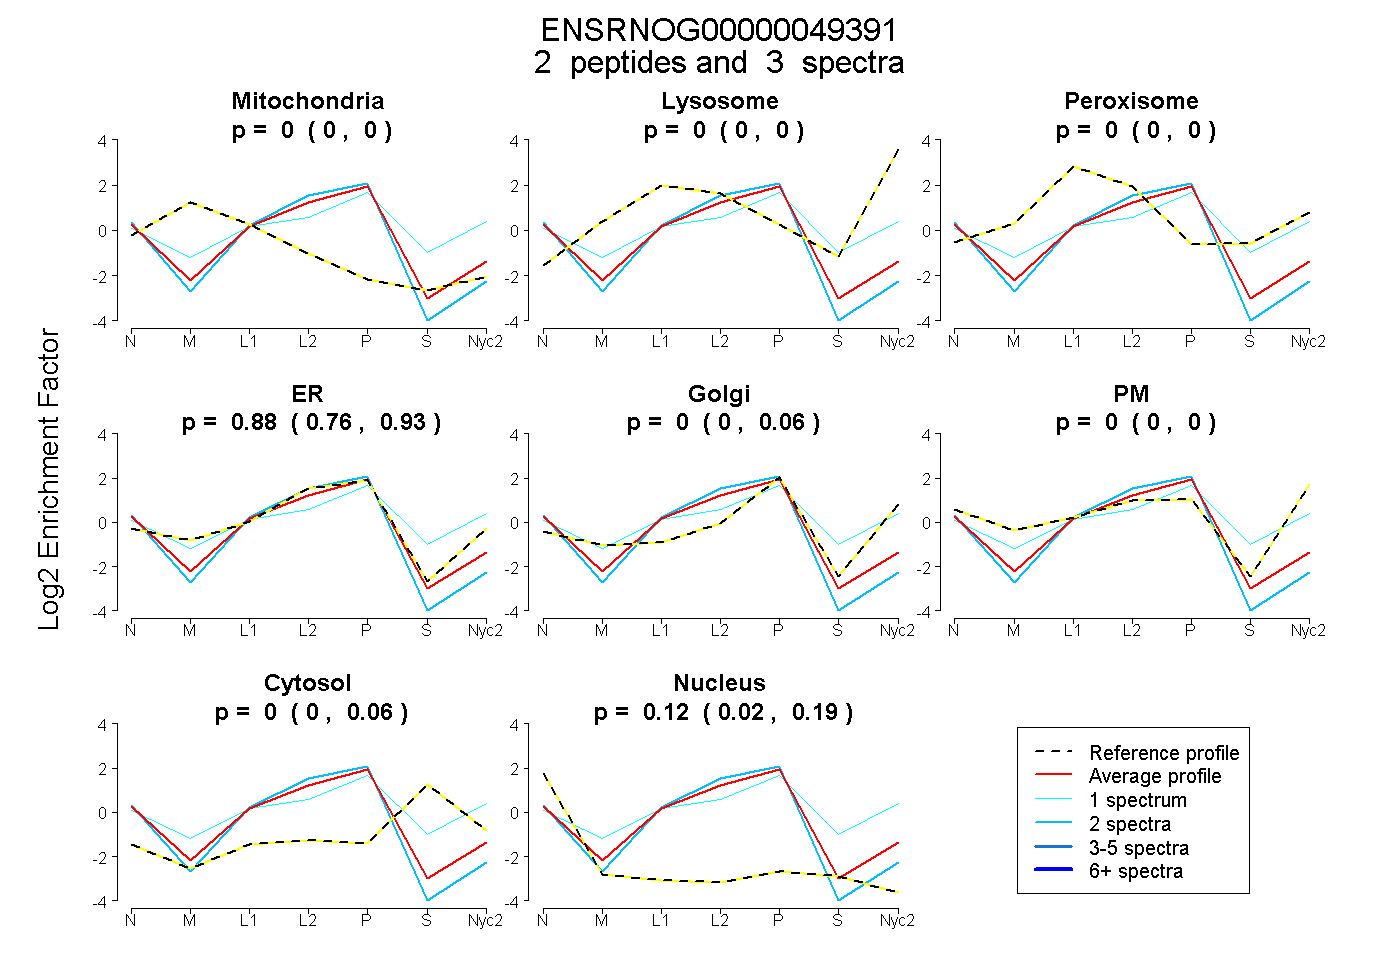
| Plot | Mito | Lyso | Perox | ER | Golgi | PM | Cytosol | Nucleus | |||||
| Expt A |
2 peptides |
3 spectra |
|
0.000 0.000 | 0.000 |
0.000 0.000 | 0.000 |
0.000 0.000 | 0.000 |
0.881 0.762 | 0.932 |
0.000 0.000 | 0.061 |
0.000 0.000 | 0.000 |
0.000 0.000 | 0.062 |
0.119 0.023 | 0.187 |
||
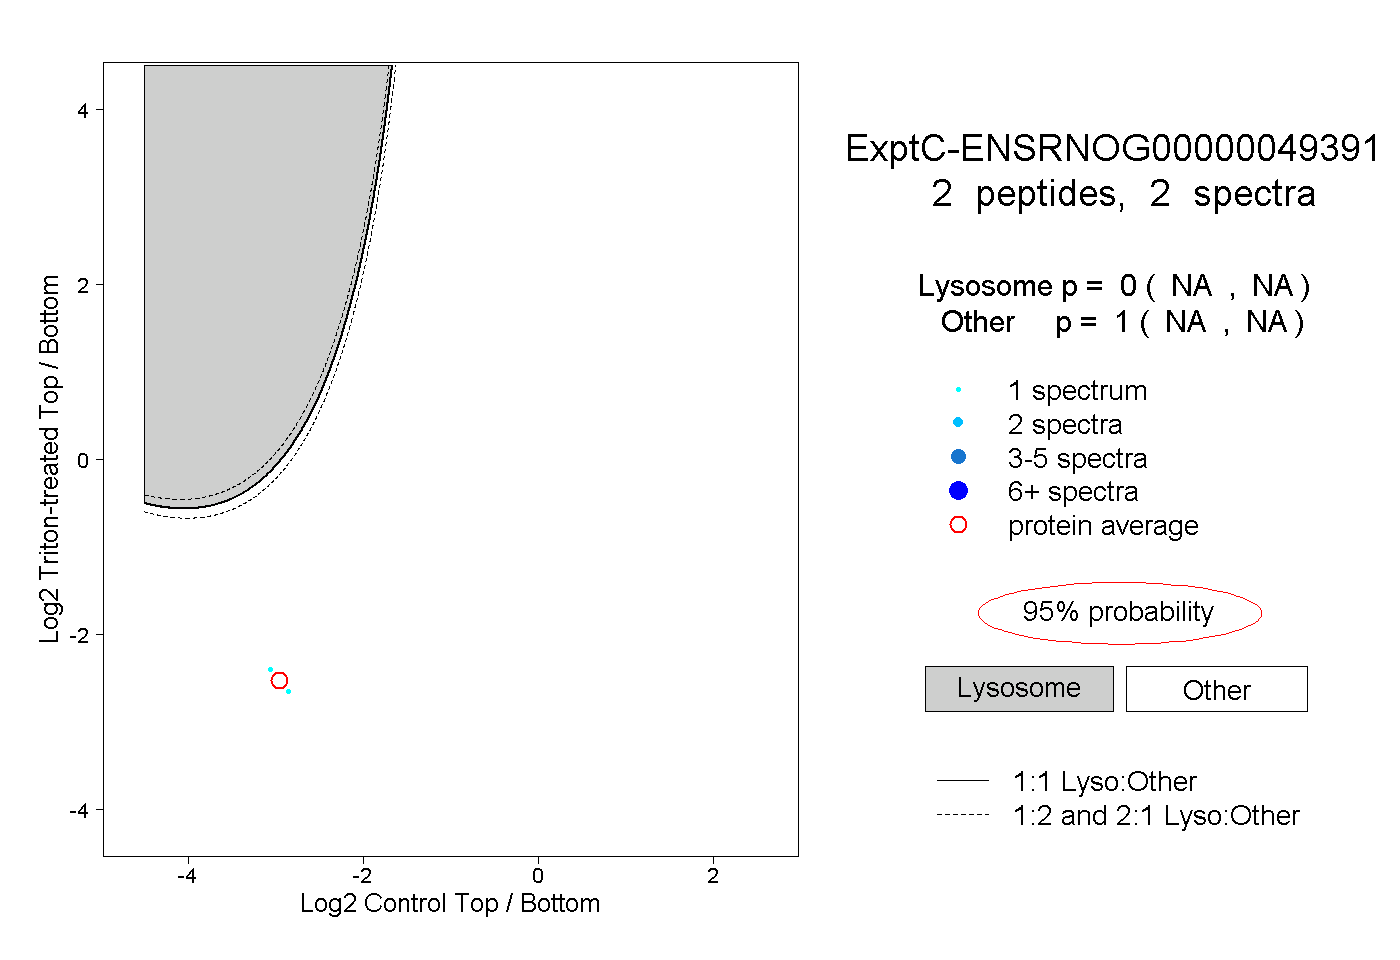
| Plot | Lyso | Other | |||||||||||
| Expt C |
2 peptides |
2 spectra |
|
0.000 NA | NA |
1.000 NA | NA |